Tuesday, December 23, 2014

Active-Trader - Welcome Fib Lines

Welcome back Active Traders.

Since my previous post, I have made some excellent progress on my indicator which I will call Fib Lines.

This screen show shows how the indicator is working on GPRO as of 12/22/2014.  I have been bearish on GPRO for some time, but note how it bounced right off the top of the 100% level on the daily chart and put in a "Close above the Low of the High Bar" formation.  I still remain bearish on GPRO shares which are now down almost 50% from their highs set just shy of the $100 level back on 10/7/2014.

On a side note, check out how the indicator does a very clear job at showing you where wave 1 begins and ends

Another interesting thing about Fib Lines is that its not just purely a mathematical calculation, there is human input required to find the beginning and end of Wave 1.  To see what that can mean over time, consider prior interpretation of Facebook found here,  In that, we show the 423% level (which is the last level in the sequence) at $80.88.  What happens when the price breaks beyond those levels?

The answer if course it is that it depends on the interpretation of the human analyst.  In this case, I expect that Facebook is in the early stages of a long uptrend, so I re-calibrated the beginning and end of Wave 1 and came up with the interpretation shown on the right.  You can clearly see likely support and resistance levels from this chart, so it will be interesting to see how price action plays out against these levels.

As for enhancements to my Fib Lines indicator, here's what it needs before I release it for testing in 2015:
  • Add the White lines level - as of now I have the Red and Green lines only
  • Rename the Fib levels to relationships from 100%. Once you see that, you realize some other cool symmetries such as the tree lines between 1.618 and 2.618 are actually 2.0 and 2.236 when started from 100.
  • Move the labels over to the right side of the chart since they are often out of view when left justified as they are now
  • Figure out how to distribute the fib level data over the Internet. As of now, the data is hard coded into DLL component of the indicator.
  • Add support for Thinkorswim
Some time in early 2015, I plan to make the indicator free to members of my Yahoo Group.  If you would like to join my Yahoo group, just send an e-mail to fx-mon@yahoogroups.com.


Have a Merry Christmas and a Happy New Year!

Sunday, December 7, 2014

Active-Trader - CME

Welcome back, traders and wealth builders.

This past week, I caught a nice breakout in CME group.  The shares recently cleared 2+ year old resistance in the $85 area, stepping out into areas not seen the financial crisis in 2008.

Taking a longer term look at the stock, it had an IPO in early 2005 at about $45 per share.  The stock went on to have a stellar ascent from there, trading as high as $142 at the high set in January of 2007, almost 2 years to the day from the IPO in 2005.

Then along came the financial crisis which hit the stock and hit it hard. The stock traded from the $142 area all the way down to a low of $31 set in January of 2009 almost 2 years to the day from the top set in 2007.  Funny the way this stock tends to move in locks steps of 2 years, and always setting the high and low in January.

From the low set in 2009, the stock has been on a slow and steady ascent. A quick look at the fundamentals in TC2000 show the move in the stock is well supported by expanding fundamentals. While earnings growth has flagged in the past few years, the multiple being paid for the shares seems to be expanding.

As for price levels, the chart above shows the $161% voodoo line at $90.79.  We also have the 1.272% (purple) and 1.1618% (blue) extensions of the recent high to low swing.  All 3 of these levels serve as short-term points of resistance if you are looking to flip out these positions for a short-term gain.

Long term I'm bullish on the shares as well as sister exchange CBOE which has better earnings growth due to explosive growth in trading of listed options.


Have a great week and ahead and as we enter the holiday season let me take this opportunity to thank my loyal blog readers and here's wishing you all new equity highs.

And of course don't forget to put aside some time to enjoy the fruits of your labors.

Tuesday, November 25, 2014

Active-Trader - PANW Fiblines revisited

Welcome back Active Traders and Wealth Builders.

Recall in my prior post here, I ended up on the wrong end of an Iron Condor trade after PANW reported earnings back in early September

At that point, I put the top of wave 1 (the 100% line) at just under $80 and the $161.5% line at about $102 and change.  Since then, look how beautifully PANW has held up against these levels:

1) Bounced back to the lower treeline at $87.65, almost to the tick.

2) Rallied up from that point and found resistance just above the lower snow line, then got caught in a congestion zone between the 161.5% fire line and the above snow line.

3) Next it rallied up to the upper snow line and got caught in another congestion zone between 2 upper snow lines

4) Finally yesterday (the day before earnings) it broke the upper snow line and tipped through the next upper tree line.

As to how I played it, I have been long the stock since the low $100's.  Going into earnings, I sold the 105/107 119/121 condor for a credit of 0.75.  At this point, my short strike at 119 is underwater, but I'm going to give it until Friday and look for a close below $119 to bring in max profit on the trade.

Now you may look at the above chart and make the point that any arbitrary lines drawn on chart might also show the same relationships.  You may be right about that, however keep in mind these levels were know in advance.  Similarly, the chart shows we have important resistance overhead at $125.6 and $140.11, levels at which the stock has not yet traded.  So (unlike at lot of technical analysis) voodoo is a forward-looking indicator.

Nobody can predict the future, but Voodoo comes about as close as anything I can find.

Happy Thanksgiving to all of my loyal blog readers.  Enjoy the fruits of your labors, you deserve it!

Wednesday, November 12, 2014

Active-Trader - BABA Fib lines

Welcome back traders.

Here is my first crack at Fib levels for BABA.

It's a bit early in the life cycle of this stock to declare fib levels, after all its been less that 2 months.  But when a stock is as fresh out of the gate and into new all-time high territory, its about all we have to go on.

If we clear this recent high, next resistance is at the 261% red line at 125.63.


Saturday, November 8, 2014

Active-Trader - BABA Breakout

Welcome back Active Traders.

Its been an incredible few weeks in the financial markets with new all-time highs in the Dow-30 and SP-500 on an almost daily basis.  It was a great week for earnings as well and none tells the story as well as Alibaba, symbol BABA.

Recall that BABA recently went public in the largest ever tech IPO and covered in my prior post Swallowing BABA  The company reported earnings for the first time this past Wednesday 11/5 after the close.  I approached the trade in my usual fashion, selling an Iron Condor outside the expected move.  Specifically, I sold the 92/94 108/110 condor for a credit of 0.8.

To collect the entire 0.8, all the stock had to do was remain within the short strikes which are the red lines shown on the chart.  The earnings day is shown as the orange candle on the left side of the chart.

Things went well at the outset and the stock moved mildly higher on the day after the report.  But it continued relentlessly higher and was soon beyond my short strike at 108.  I was not too concerned as sometimes the stock can challenge the short strike and even go beyond the long strike, just to give it all back and close within the expected move.

But BABA was different and started to push beyond my long strike at 110.  I was tempted to close out the short 108 call and stay long the 110 call, but experience has shown this is a sure way to lose more than the max loss on the trade which is the difference between the credit received (0.8) and the spread (2.0) or 1.2.  So I closed the 108/110 leg out for a debit of 1.55 which was a loss of 0.75 on the trade.  But I turned around and went long the stock at about 110.40.

From there it was onward and upward and the stock really took off to the upside.  I looked at this chart in the context of many other big winners in the Internet space such as GOOG, LNKD, PCLN and NFLX,  It occurred to me that nearly all of the other stocks had broken charts - in other words they were well off their highs and in the state of repair.  BABA on the other hand was fresh out of the gate, reaching new all-time highs and potentially much earlier in its life cycle and setting up to be the next great Internet stock.

So I did the only logical thing and bought more and went out long on Friday as the stock crossed 114.30.  The shares continued to rally and closed at a new all-time high at even higher in the after hours session.  I am expecting a gap up on Monday before the stock takes a rest in the $120 area.

Have a great week ahead.

Saturday, October 25, 2014

Active-Trader - Adverse Excursion

Welcome back,  Active Traders and Wealth Builders.

Within the past 6 weeks, SPY has been up 8.7% for the year (as of mid September), then October's plunge took it to just barely up 1% for the year.  From there we had a fierce bounce back and are now up 6.29% for the year.  What a wild few weeks!

This past week was a huge one for earnings.  BIIB was the trade of the week where I put on the 310/312.5 - 337.5/340 condor for a credit of 0.98, well past my minimum credit of 30% of the width of the spread.   The short strikes are show in red and the long strikes are shown in green on the chart on the left.  I put the trade on just before earnings at the blue bar in the middle of the chart.

After hours BIIB traded down hard, well below my short strike as going as low as 290.  It was not looking good and I was facing a max loss situation with my short strike almost 20 points underwater.

But I stuck with it and BIIB bounced hard off the lows. It bounced so hard (as a matter of fact) that I sold another PCS (the 302.5/305) on the way back up for a credit of 0.81..  All of those trades went out max profit which is clearly a good thing.

Its a case where adverse excursions outside the market maker move will very often retrace due to the forces of the market makers themselves.   We had a very similar situation in AMZN where the stock move against me for a max potential loss in the after hours session, then retraced and closed within the Market Maker Move for a max profit.

All this makes me realize that I'm not at all cut out for day trading.  Day trading is more like a hair-trigger video game where the market is brutal and will seek out every stop and shake out every weak money player.

Weekly and monthly options trading is more like a chess game, and a much more forgiving one at that.  It doesn't matter how hard the price moves against you.  All the matters is the price at expiration and experience has shown that prices will remain within the Market Maker Move the majority of the time.   When prices exceed the Market Maker Move (and do so in an impressive fashion such as ALXN this past week) great directional trades are born.

Also notable this week were new all-time highs in AAPL and Facebook (FB).  Facebook reports earnings this coming Tuesday after the bell and you know I will be trading that one.

Have a great week ahead.

Saturday, October 11, 2014

Active Trader - Short against the Box

Welcome back Active Traders.

It was a bruising week for the bulls, with the markets selling off sharply and taking out the recent lows set in mid-August.  Even so, the markets have come back to levels set in mid May of 2014.

Taking the long view, the SP-500 has come a long way from the low set during the financial crisis.  I ran the numbers and SPY bottomed at 67.10 back in March of 2009 and had its highest closing high at 201.85 back on September 19, 2014.  So the SPY is up nearly 200% from that low.  Given Friday's close at 190, we are off only 5% of that total move which is not that much.

Since the year 2000, we have had 2 major sell-offs which cut the market nearly in half.  I don't expect that type of damage given the perpetually low interest rate environment.  However, we clearly could go a lot further to the downside.  How to cope with it?

1) Don't let any open positions exceed your pre-defined stop-loss value.

2) Take it from day to day, Focus on what's happening today and trade it.

3) Wait for a rip-the-shorts-heads-off rally, then put on an offsetting position.  This past Tuesday was a perfect opportunity where the market ripped to the upside then stalled out right at the top of a declining trend channel.

The quickest and easiest move is to short-against-the box or simply sell short an equal amount of what you are long.  This has the following advantages:

  • Your position is effectively flattened - minus commissions of course
  • You avoid capital gains taxes on your taxable accounts
  • In your IRA you can just sell the shares since you don't have the problem with capital gains tax.


But don't overstay on the short side since on a longer term basis the odds are not in your favor.

At most, you are going to catch only part of the down move and that's okay.

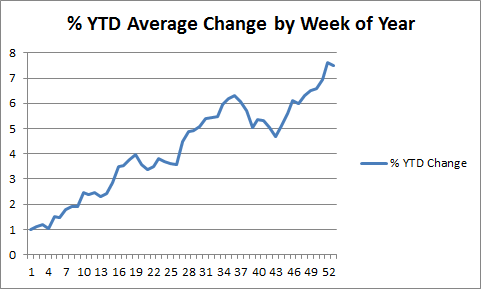
Just hearken back to the Average Change by Week of Year chart from my post Evidence of Autumn.  Looking at this chart, you will see that the market tends to sell off during this period, but on average, closes higher by the end of the year.

So don't get too bearish and abandon all your longs, because history shows your losses will recovered and your account will eventually go on to higher highs.

So tread lightly for the remainder of October, it will be November in a few short weeks. Have a great week ahead.

Friday, October 3, 2014

Active-Trader - Fib Lines Improvements

Welcome back Active Traders.

In response to a comment from my friend Franklin, I started to contemplate ways to improve the drawing and calculation of fib levels.  If you have not read my prior posts on the topic, go back and take a look because I have found fib lines to be the single most significant discovery in all my years of watching the markets.

My first idea was to write a script in Thinkorswim - In a language I believe they call it Thinkscript. But then it occurred to me there's a much simpler approach.  Simply configure the settings inside the Fib Extensions tool to draw not just the major (red) lines, but also to draw all the subsequent green and white lines.

To make that happen, I needed to calculate all the subsequent lines as as percentage of the original 100% move.  In other words, instead of drawing the 1 and 1.618 lines, then drawing the lower lines at 38.1 and 61.8, simply calculate the levels for the intermediate (tree) lines and just add those to the Fib Extensions tool in Thinkorswim.

To calculate the levels,  I wrote a recursive algorithm in C# which calculates the levels to an arbitrary level of depth, but stopped at 3,  I figured the levels would work as follows:

Fire Lines
0 - Tree Lines
1 - Snow Lines
2 - Minor Lines (no name for these that I am aware of).

Here is what the output looked like for the lines between 1.0 and 1.618:

Lowerline: 1.2361 Upperline: 1.3819 Level: 0
Lowerline: 1.0902 Upperline: 1.1459 Level: 1
Lowerline: 1.0345 Upperline: 1.0557 Level: 2
Lowerline: 1.1115 Upperline: 1.1246 Level: 2
Lowerline: 1.1804 Upperline: 1.2016 Level: 2
Lowerline: 1.2918 Upperline: 1.3262 Level: 1
Lowerline: 1.2574 Upperline: 1.2705 Level: 2
Lowerline: 1.3049 Upperline: 1.3131 Level: 2
Lowerline: 1.3475 Upperline: 1.3606 Level: 2
Lowerline: 1.4721 Upperline: 1.5278 Level: 1
Lowerline: 1.4164 Upperline: 1.4376 Level: 2
Lowerline: 1.4934 Upperline: 1.5065 Level: 2
Lowerline: 1.5623 Upperline: 1.5835 Level: 2

Then I went to enter all those into the Fib Extensions tool in Thinkorswim  I figure I could make the minor lines lighter lines with dashes, etc so the lines would not overwhelm the chart.  But I quickly learned that the Fib Extensions tool in Thinkorswim was limited to 15 arcs.  Sigh, so much for that plan.

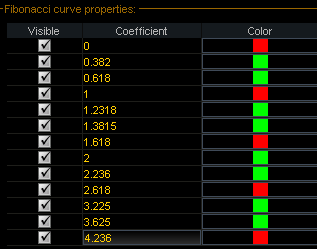
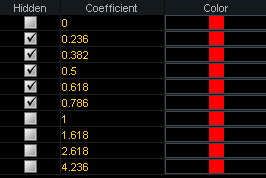
In any event I came up with the following configuration which includes the red and green lines and calculate those automatically when you highlight wave 1.  Using those, I was able to draw the fib lines for IWM.  The red and green lines drew automatically, but I had to draw the snow lines manually due to the 15 arc limit in Thinkorswim.

In the end, it looks like the Thinkscript might be a better solution, but this is somewhat of an improvement.

Have a great weekend and week ahead.

Saturday, September 27, 2014

Active-Trader - Fib in GPRO

Welcome back Active-Traders.

Very few companies who have gone public in 2014 have had the spectacular performance of GoPro symbol GPRO.  The shares debuted at $28.65 back on 6/26/2014.  Today, a mere 90-plus days later, the stock closed the day at $82.10 which is an amazing 86% gain from the IPO price.

When and where will the move end?  Read on for my explanation of how fib analysis can answer these very relevant questions.

Recall that Fb levels are simply multiples of the magnitude of Elliot Wave 1 which is basically the move from a bottom to some top which resulted in the first meaningful pullback. Finding the bottom and the top of Elliot Wave 1 is the first and most important thing you need to know to calculate fiv levels.  Let's look at GPRO.

The chart on the left shows my first take at the Wave 1 move for GPRO. Note how the price found a bottom, rallied up, then fell back to the breakout point and found some support once again. This is typical of Wave 1 moves where the bottom is the lowest low on the chart and is not violated to to the downside.

Once you know those numbers, you can project the 3 most important lines beyond wave 1 which are the 161.8%, 261.8% and 423.6% and the associated price levels.  We know the levels are correct when we observe how price reacts to those levels as it rises. Doing so we find that the 161% level at $66.70 was quickly violated to the upside then became an important level of support moving forward.

Since then the stock has been straight up and we find ourselves just a point or 2 below the top of the sequence, the line which represents 423.6% of Elliot Wave 1 move.  So there's our first price target - $83.46 which I expect we will reach not far into the trading day this coming Monday.  But is that it - the top of the top?   Let's look for another interpretation.

Instead of Wave 1 ending at 47.97 on 7/31/2014, lets assume it ends at 56.86 on 9/3/2014.  In this case, note how the 161% line also acted as an area of resistance instead of support as in the prior interpretation.  This adds some extra credence to this second interpretation and based on that we find the 261% line overhead at the $89.42 price level and the 423.6% line up at just under $122 price level.

All that said, I expect higher prices in GPRO with the first target at $83.46 and the second target at $89.42 which I expect we will see by the end of next week.  I went out long the 80-84 Call Debit Spread and some shares.

Have a great week ahead.

Saturday, September 20, 2014

Active-Traders - Swallowing BABA

Welcome back Active Traders and Wealth Builders.

In was an historic week for market watchers as we watched Alibaba trade publicly for the first time.  It was also a great time for the capital formation process as the market successfully digested almost 220 Billion of new market cap.

On your left is a graphic of all companies with Market Cap over 100 B.  If you add them up, it comes to about 2.8 T or 2,867 B.  With BABA's market cap of 220 B, it comes somewhere between FB and GOOG in terms of capitalization.   That represents an almost 7% increase in market cap that had to be absorbed.

All in all, it was a great week as follows:

- The BABA IPO worked as expected with no technical glitches

- SPY was able to make a new all-time closing high on Thursday before giving some back on Friday.

- US Fed came out and said they are going to keep rates low for a long, long time and that they can make up any new reasons they want for keeping rates low - in other words they don't have a fixed formula for when they would raise rates.

- The fact that China's largest Internet company  (who could presumably list on any stock exchange they wanted) came to the New York Stock Exchange and the US markets to list their shares is a tremendous vote of confidence for the US financial system.

All this said, the US Dollar is rallying strongly against most other currencies.  The US Economy seems to be rolling along, and the rest of globe wants to come along for the ride.

Have a great week ahead.

Wednesday, September 10, 2014

Active-Trader - PANW Fib Lines

Here is a quick look at fib targets for PANW. The first target is the 161.8% line at 102.88

This trade started out as a condor into earnings.  I sold the 82/84 95/97 condor on Tuesday for a credit of 0.72 and a max loss of 1.28.  The stock cooperated and held below the short strike at 95 in the pre-market Wednesday and tested it briefly during regular market hours then pulled back. Everything looked good for the stock to close the week out between 84 and 95 for a max profit.

At about 10 AM the stock started running and was soon at the 95 level and threatening to put my trade underwater.  It kept going and I scrambled to close the 95 short call at a limit of 2.6 for a net loss of 1.88 - greater than my original max loss, but I was still long the 97 call.   I ended up closing the long 97 call for a credit of 1.05 lowering my loss to a mere 0.11 not counting commissions.

Realizing I had a potential runner, I bought some stock in my other accounts as it crossed 96 in the 96.25 area.  The stock did nothing but run to the upside and nearly broke $100 before pulling back. I ended up closing the position out in the high 98's when it failed to break 100.  Overall I took just over 2 points out of PANW.  This was a classic case of an earnings trade gone bad, but turned out to be a winner anyway - another case of Lemons into Lemonaide.

I expect PANW to continue to the upside, but I'm not going to consider any new longs until it returns to the breakout point at 92.70.

Sunday, September 7, 2014

Active-Trader - Stairs up, Elevator Down

Welcome back, Active Traders and Wealth Builders.

One popular staying you hear about the markets is that stocks take the stairs up, but they take the elevator down.  Put simply, stocks sell off much faster than they go up.  How much faster you might ask?  Observe on this chart of AAPL that it took nearly 10 days for the stock to go from the 97 area to its highest closing high at about 103.  Also notice that the stock sold off hard from that level and gave back the entire 10-day advance in a single trading day.  How's that for fast?

Another example occurred this week in Gilead (GILD).  Note how the stock took 13 daily bars- almost 3 weeks of trading to go from the 99 level to its high at just about 110.  But the stock sold off the entire distance in just 2 short trading days!   Notice however that GILD had a much sharper reaction off the low and formed what we call a bottoming tail bar.  That means the stock sold down and quickly recovered that sell off within the same trading day.

I bring up these 2 examples because I got caught on the long side with both stocks.  After a long bull market you get lulled into a sense of complacency and don't consider putting in stop loss orders, particularly if these positions constitute less than 5% of your portfolio which is a reasonable maximum percentage allocation for a position in which you have an average degree of conviction.

So what can you do to avoid situations like this?

1) Put a stop below the low 2 bars back.

This strategy would have kept you on the long side of the moves in AAPL and GILD, but gotten you out before much of the damage was done.

2) Put a stop below the low of the high bar

I learned this strategy from John F Carter's excellent book Mastering the Trade.   This strategy would have gotten you out of both AAPL and GILD about halfway through the advances and is therefore more suited to those who actively trade full time.  They also would have gotten you out of the sell-off much sooner and with less of a loss assuming you were long going into the top.

As to when to re-enter, here a few rules of thumb:

1) Don't buy the first bar down after big sell off!  Many players do not watch the stock market during the day and only see the end of the day bar.  Once they see that, they panic and sell at the open the next day adding further to the slide.  Usually, but the 3rd day everyone who was going to sell into the panic has done so already and stock is ready to start to base.

So whenever you get a big sell off, whether its earnings related or not, wait for the 3rd day after the announcement for the stock to base before considering longs.  At this time, you usually get some reversion to the mean, for example fills of prior gaps, etc.

2) Buy when the stock breaks above the high of the low bar.  For GILD, that would be 106.6 and for AAPL it would be 100.9.

As for another angle, look for stocks which have been unfairly punished but the fundamentals are still good.  In the Energy space, we are seeing a 14-month low in the price of gasoline.  As scary as it sounds, I expect fossil fuel prices to double in the next 10 years. That means $8 per gallon gas which is what it costs in many other parts of the world already.  Get your shopping list ready and take your pick, COP, RIG, XLE, OIH.

Have a great trading week ahead.

Sunday, August 31, 2014

Active-Trader - All eyes on AAPL

Welcome back, Active Traders.

Last week's post AAPL New Highs 2014 marked a new all-time high in AAPL shares and was followed-up this past week by even more highs and the graphic on the left announcing a big product launch in early September.  Speculation is rampant that Apple will announce the iWatch or the long awaited iPhone 6 to challenge the competitor Samsung Galaxy s5.

First of all, you have to admire Apple's timing.  Not only are they waiting until the end of the summer vacation season, they are waiting until the first full week of September where everyone is back from vacation. Also, they are waiting for a Tuesday when everyone is recovered from the weekend and fully ready to start ramping up for the 4th quarter which is typically strongest for AAPL shares and the entire retail selling season.

As trend followers, its our job to pay attention to the obvious clues regarding price action, and it doesn't get much more obvious that we are expecting a run-up in AAPL shares ahead of this announcement.  How high to we expect APPL to go?  To get our answer, we turn to the voodoo lines as shown on the right.

Our first target is the upper snow line at 103.09 which is just a chip-shot from Friday's close at 102.5 and will likely open at or above that level by the open on Tuesday.  Beyond that, we have the 432% fire line above at $106.52.  That represents the upper-most fire line in the fib series and beyond that we have nothing more to rely upon technically except for round numbers (such as the $110 price level) and Fibonacci retracements of prior swing lows.

Based on that, I think its highly likely that we will see $106.5 before this move is over and it should be played with the weekly (expiring 9/12/2014) options to including action up to and including the announcement.

The $106.5 price level is a mere 4% higher that the current price level of the stock which is not much of a stretch for most stocks.  But keep in mind that AAPL is the single highest capitalized stock in the US market with a stunning 612 Billion in Market Cap.  That 4 point move represents 23.6 Billion in Market Cap which greater than the GDP of most African countries and is no small move. So expect AAPL to drag the entire market higher, but don't expect moves to be fast and furious.

As for how I am playing it, I am long the shares in both my regular and retirement E*Trade accounts and long the October Monthly calls in my Tradestation account.  The October 90 calls can be purchased for less than 50 cents premium above the price of the shares.  For example, you should be able to buy the October 90 calls for under $13 per contract.  That means you get a $102.5 dollar stock for $13 a share.  Don't load up the boat, but get long here for a run up into the announcement.  It doesn't get much more obvious that this traders.

Have a great week ahead and come back next weekend for the start of my new series on the TTM Squeeze indicator.

Saturday, August 23, 2014

AAPL - New All Time Highs 2014

Welcome back Active Traders.

This past week was a milestone for one of my favorite stocks AAPL - Apple Computer.  Recall we made some good money through 2011 and 2012 buying breakouts to new all time highs in AAPL.

Things continued in a similar fashion until AAPL topped out in September of 2012 and went into a long, steep correction that eventually erased 40% of the stock's value.  The general market as measured by the SP-500 also pulled back at about the same time, but bounced and recovered a mere 2 months later late in November of 2012.  AAPL instead continued to slide.

Things took a turn for the positive when the downside trendline was broken in May of 2013 and marked by my post AAPL Trendline Break. Recall this bottom corresponded with a number of shareholder friendly moves made by AAPL management which had been more or less ignoring the concerns of the shareholders.

Fast forward to August of 2014.  Since then AAPL has had a 7 for 1 stock split - another shareholder friendly move - and finally threatened the old all-time closing high at a split-adjusted 100.75.  I went long some AAPL shares on Tuesday 8/19/2014 in anticipation of a move to new all-time highs.  I followed up with the September monthly 90/110 Call Debit Spread.

I am expecting higher prices, but keep in mind that AAPL is the highest capitalization stock in the US Market at 602 B a full 30% higher than the next closest stock XOM - Exxon Mobil.  This means that it will move slowly and a 10% move up to 110 will not come quick or easy.   This means that AAPL stock will not make you rich at this point - if you are not rich already - but is still worth a long position in my mind.

As for stocks which will make you rich, I prefer earlier stage names such as GILD and TARO.

TARO is a particular favorite with a mere 6.6 B of Market Cap and other key features:

- 5 year earnings growth rate of 47%

- PE of 19.5

- Average Daily volume of only 76 K shares

Consider that in light of a new all-time high in the shares, and I continue to expect higher highs in TARO.

Have a great weekend and great week ahead.

Saturday, August 16, 2014

Active-Trader - Are you trading?

Welcome back, traders.

A funny thing happened to me this past week, I looked back and my recent behavior and realized, I was trading!  Now that sounds silly since I have been trading and investing for the better part of 30 years.  But this was different and here's how you know if you are trading or just on your way to becoming a trader:

5) Its Automatic

Your trading becomes a habit which almost exercises itself.  You don't have to think about it, its just happens by default.

One such trade happened with GILD this past week when in broke decidedly above the 261% fire line at $95.  I went long on the close in a classic case of John F Carter continuation.  The stock opened the next day at $98 and barely looked back.  I'm continuing to hold expecting a test of one of the 2 tree lines above.

4) You are trading setups and setups only

You don't take trades just because you thing something is going to happen.  For example, I was really convinced that GPRO was going to close below $40 and was tempted to sell the weekly 40 strike.  But other than that strong feeling, there was no setup.  GPRO did closed below 40, but it didn't matter.  I didn't take the trade and that's fine.

3) You are controlling your risk

Your positions have an automatic loss cut built into the trade structure.  This is easy to do with option spreads.

 I don't do a very good job with risk control on equities, so I guess I'm more of an investor than a trader in stocks so I fail the trader test there.

2) You are not emotionally invested in the outcome.

It doesn't matter whether you win or lose a particular trade.  There's always another trade and always another day.  As soon as you remove your emotions from the picture, the process and execution becomes more mechanical.

1) Your making money.

Have a great week ahead.

Thursday, July 31, 2014

Active-Trader - Fib in NFLX

Welcome back Traders.

At the request of my friends in the Financial Trader chat room, here are Fib levels for NFLX.

The 238% fire line at $432.47 has acted as resistance recently.  The next snow lines for support are at $411.14 and $398.53.  Next major support to the downside after that is the tree line at $376.46.

In fast moving markets sometimes these lines only provide a short term pause, so tread carefully.


Sunday, July 27, 2014

Active-Trader - Sailing the High Seas

Welcome back, Active Traders.

I just got back from 7 days on Royal Caribbeans Freedom of the Seas sailing the ports of the Western Caribbean.  This blog is all about Money and Markets, so why am I talking about Cruise ships?  Because if your play your cards correctly, its an amazing deal. Allow me to explain.

Faced with the idea of how to take a family of four on an amazing vacation, what are your options?  Here are a few as I see it:

- Rent a beach house for $1500-$2500. That gets you lodging and some entertainment from the beach, but entertainment and food is all extra.

- Book a week at an all-inclusive resort in Mexico or the Caribbean. That will set you back about $800-$1000 per person including food (and maybe drinks) but before airfare. Some entertainment is included but it can get old quick.

- Rent a motor home and take a drive or go camping if you are the type to 'rough it' in the woods. This would not work for my family where the girls need clean rooms and their daily shower and enjoy getting cleaned up in the evening.

 So what's the alternative? Pay about $1000 per person and and get yourself on a Cruise ship and get all this: 

- 7 days of nearly unlimited food and non-alcoholic drinks

- World class evening entertainment including Broadway style shows, comedians, acrobats, musicians, you get the picture.

- You get to visit one or more tropical port destinations. No two days are the same and the scenery is always changing.

- Seven days at sea which is a life-changing experience in itself. Go to bed to the gentle rocking of the ship and wake up in a new place in the morning. How cool is that?

So where's the trading angle and why bring it up on this blog?

The simple fact is that the cruise line doesn't make a thin dime on all the basics, food, lodging, entertainment, etc. Their entire profit comes from everything they try to sell you once you get on the ship. And there is not shortage of profit centers once you get on board. So here's my advice for you first time or repeat cruisers:

- Alcohol is one area where they have you in a bind. You can't bring any alcohol on the ship from the ports. Drinks run about $6 for a domestic 16 oz beer or about $8 for frozen drinks. I enjoy a few beers as much as the next guy, so all you can do is keep your consumption down or spring for the $45/day unlimited beer/wine package.

- Gambling is a big profit center. Anyone who has studied the odds knows that gambling can be expensive entertainment. My advice is to avoid the casino. Ditto for bingo which is simply gambling for the less educated. Both of these areas are taxes on people who are bad at math.

- Speciality Restaurants - this might be worth it if you a looking for an extra-special dining experience for an extra $20-$25 per person. For me the regular food was more than adequate.

- Shore Excursions - this is an area where it depends. If you are just looking for a beautiful beach, you can walk or take a cab from many ports. Much of the time the excursions being offered from the ship are overpriced and not worth the cost. We did one excursion (at $87 each) which included 6 hours of beach, water sports, Wi-Fi and unlimited beer, wine and frozen drinks. You can bet I took advantage of the open bar.

- Wi-Fi and communications may be an issue. Once you get out to sea, cell services is charged at international roaming rates. The ship will charge as much as $20/hour or $187 for unlimited Wi-Fi for a week its best to plan to be incommunicado. Advice is to put those phones into airplane mode and keep them there. You may be able to find free or low priced ($10/day) Wi-Fi in the ports.

What are the downsides of cruising?  You know I always tell it like it is, so here goes.

- Crowding can be an issue. There were times when the buffet area was so crowded, it was a challenge to find a table. I don't like crowds, but I just had to tolerate this.

- The same areas that were wall-to-wall people during peak times were beautiful and quiet after hours and waking up for your morning coffee and looking out at the ocean is amazing and well worth it

- Getting on and off the ship can be a hassle with long lines and some patience is required.

- You do have to get a bit dressed up, so bring some khakis, at least one button-down shirt and maybe a blazer.

- Finally health issues can be a concern. The cruise line does a great job here by encouraging frequent hand washing and providing alcohol hand sanitizers outside every dining area.

All told, I paid about $1000 a person each for my family of 4 (not counting airfare) and got away with only about $500 in extra charges. But I came away with some amazing memories, pictures and one very happy family.

So get out there and enjoy the high seas traders. Play your cards right and you will come out way ahead on this trade.

Saturday, July 19, 2014

Active-Trader - Short the VIX

Welcome back Active Traders and Wealth Builders.

One of the great things about investing in the stock market is that it has a positive historical bias.  That means that you can simply buy a broad stock market index and if you hold onto it long enough you are bound to make money.  Throw in dividends and the picture gets even better. It makes me wonder why anyone would bother with any other asset class given how liquid stocks are.

What if we found something to trade that did the exact opposite over time, that is go down or lose value?  Would we be able to take advantage of that persistent trend?  Of course we would.

And such a symbol does exist in the form of VXX - The SP500 VIX Short Term Futures ETF.  There are a number of VIX ETF products, and virtually all of them go down over the long term, but VXX takes the cake as follows.

VXX debuted back in January 30, 2009 at a split adjusted price of $6,918 per share.  Since then the VXX has fallen to a closing value on Friday of $27.89.   On an annualized basis, that is a loss of -66% per year! Over time the long term performance of the stock market is approximately +7% per year.  That means that a short position in VXX would out-perform stocks on a 10 to 1 ratio!   In fact, they need to reverse split the VXX (where you have fewer shares but at a higher price) just to keep the price above zero.

My first idea is to simply short VXX.  Unfortunately, that's not allowed since VXX is not on the "Easy to Borrow" list.  The ability to short VXX is reserved for the issuer, someone much higher up the financial food chain then myself.  The good news is that you can trade options on VXX and the other VXX products.  As for bearish trades, you can either buy puts or sell calls.   Selling calls is preferable since with those positions, we can be on the winning side of theta decay.

VXX seems to do basically the opposite of stock prices.  When stocks rally VXX drops.  When stocks sell off, VXX rallies hard and fast.  This past week was a good case in point and the low of the week in VXX was 27.02.  On Thursday when the market was ugly and the Dow 30 was down about 150 points, VXX rallied hard up to about 30.  I saw this as an opportunity and sold the weekly 30/31 Call Credit Spread on Thursday afternoon for a credit of 0.25. Typically when I sell spreads, I want to take a credit of at least 30% of the width of the spread and this one was only 25%.  But with VXX at a short term high and one day until expiration, I took the trade.

After hours, GOOGL reported good profits and the stock market sell-off came to an end.  The next morning VXX opened at about 28.8 and never looked back.  So I took a max profit on that trade without even requiring a closing transaction.

So keep an eye out for trades as follows.  When things get ugly in the stock market, wait until it gets to a point of maximum pain, when you feel you just have start unloading stocks to ease the pain of loss.  Then sell some VXX calls and wait for the VXX to come back to earth.

The other thing you can do is simply buy VXX if you expect things to get ugly. But don't overstay since the odds are against you holding VXX on the long side.

Have a great week ahead.


Sunday, July 13, 2014

Active-Trader - Trading around FB

Welcome back Active Traders.

As you know one of my favorite stocks in this environment has been Facebook. I am a regular user of the site and a big fan of the stock.

One of the great things about Facebook as both a company and a stock is they are constantly being under estimated.. Recall that after a widely publicized and somewhat disastrous Initial Public Offering back in July of 2012, the stock traded sideways to down and reached a low of about $18. I remember that well because I sold down there once the stock broke $20 and it looked to be on its way to the single digits.

But then something transformative happened on July 24, 2013.  The company reported better than expected earnings that proved the company could provide strong growth on all levels, from monthly users to revenue to profits.  The stock reacted immediately gapping from the $26 level up to about 32 on that news alone.  Since then the company has delivered strong user, revenue and profit growth in every quarter since then.  They even proved they can monetize the important and growing mobile device user segment.

And then news came out that teens who had previously reported that they were no longer using Facebook
because it wasn't cool,  were actually still using the service, just not willing to admit it.  Most teens instead like Instagram, the photo sharing site also owned by Facebook.  Instagram does not yet produce ad revenue, but I expect FB will start to monetize that platform when the timing is right.

As to how I have been trading FB, I was long from a position in early May which I unloaded up the high 67 area.  They I reloaded on a bounce of the voodoo support area at 62.31 and exited for a quick profit just short of the 65 area.   The next day, we got a gap down to the 63.5 area where I once again went long and took profits when it filled the gap later than day at the $65 area.  Since then the stock has moved higher without me and I will be looking to be long the stock into earnings which are expected on Wednesday July 23 after the close.

Have a great trading week ahead.

Friday, July 4, 2014

Active-Trader - Triple Breakout

Welcome back Active Traders and Wealth Builders.

Dr Ivor Royston, cancer researcher and co-founder of Biogen Idec was once quoted as saying:

"There are three types of people in the world: Those who make things happen, those who watch things happen, and those who ask: What happened?"

When it comes to the stock market, I am clearly in the 2nd camp.  I don't have enough capital to move the markets, but I am certainly a keen observer.  So the question is, if a major breakout occurred in the stocks you are following, would you be able to spot it?

I ask because we had major breakouts in all 3 of the US stock market ETF's in the past week.  I think
everyone expected a rally on Monday for end of 2nd quarter window dressing.  Some even could have expected some buying on Tuesday as new money came into the market for 401K and pension funds who have into invest their new monthly fund in-flows.

But I don't think anyone expected the follow through in the major indexes we saw later in the week as the SP-500 and Dow Jones Industrials made new all-time highs. The Nasdaq 100 is approaching its all-time high at 120 set back in the Dot Com boom back in the year 2000 and seems determined to take on that value and join its peer indices in new all-time high territory.  Therefore, if I had to bet on either of these 3 ETF's now, I would say that QQQ has the best upside potential.

All this bullishness of course led to new all-time highs in my net worth, but is that an accomplishment to celebrate?  Don't confuse brains with a bull market I like to say.

Getting back to the point of this blog post, what does this mean for our trading?  Simple as follows:

1) Run the New High, Low PE, High Growth scan as described in my prior post.

2) Run the above scan between 3:30 and 4PM EST on market days.

Its best to run at this time of the day since most of the daily bar has already been formed, but the trading day is not yet closed.  It kind of like waiting for the horses to clear the Clubhouse turn before placing your bets. If you had the change to do that you would right?  Of course and you would since its like placing your best just before the race ends.

3) Buy breakouts to new all-time highs after period of consolidation.

This item gets to the guts of this post.  Look at the charts above.  Notice how there is a single daily bar when the stock or index breaks above recent resistance to a new all-time high.  This is the point at which you want to enter.  Those bars are show above in gold.  Take the time out of your day between 3:30 and 4:00 PM and enter on breakouts.  If you follow this simple method (along with items #1 and #2 above) you will be financially rewarded and then be able to take care of your family, grow your wealth and enjoy the fruits of your labors.

Happy 4th of July to all and God Bless America.

And have a great week ahead.

Sunday, June 29, 2014

Active Trader - Range Expansion

Welcome back Active Traders and Wealth Builders.

Many of the posts in this blog talk about active trading.  Truth be told, I find investing much easier.

As an Active Trader, if I could make say $1000 a day, I could pay all of my bills and live a pretty good life. But what are the chances I could make $1000 a day, day in and day out without a big losing day to come along and set me back?  Less than certain to be sure.

We don't want to hitch the wagon of our financial future to anything less than a highly reliable probability of a positive outcome over time. So we are led to the inevitable question, what does work?   Probably a more relevant question is - What works for you?  That's up to you to answer.  Here's what works for me - after all, that's why you are reading this blog, right?

1) Excellent 5-year earnings history as measured by a 5-year earnings growth rate of greater than zero.

Anything less than zero is good and rates in the 10-20% are pretty common.  Only a handful of stocks have 5-year earnings growth rates greater than 50% and one of them is TARO.

2) Reasonable valuation as measured by the PE or Price to Earnings Ratio.  TARO has a PE of 16.

3) New all-time in price.  Bingo for TARO.

4) Range Expansion - The High-Low for a given bar must be greater than those that came previously.

I got to thinking about this last one, and figured it might be a good criteria to add to my favorite scan New High, Low PE, High Growth.  So I took a look around TC2000 and found the following built-in scan called Range Surge with the following built-in formula:

(H - L ) / (AVGH60 - AVGL60) >3

I ran that against the SP-500 and got only one hit, DG or Dollar General.  Then I ran it against all 8000 US Stocks and got 85 hits, and TARO was among them.  So should I add Range Surge to my list of criteria for breakout stocks?

I thought about it and decided against and here's why.

Range Surge is an excellent entry signal and often signals a huge change in the underlying prospects for the company.  But there are many excellent stocks worth buying that are not necessarily having a range surge.

Range surge is instead a flag to alert you to the chance in prospects for a stock, and therefore it deserves to be run independent of the above criteria.  If it happens to overlap (in the case of TARO), that's even better.

Range surge is also good for finding strong continuation candidates.  You might look at a chart like TARO and say that's not a good entry point and you should wait for a pullback.  I would tend to disagree because in my experience, I find that the best stocks take off and never look back.

Have a great trading week ahead and watch for Range Expansion.

Saturday, June 21, 2014

Active-Trader - Flip at Extensions

Welcome back active traders and loyal blog readers.

One of the things I found difficult in my early days of trading options was when to take profits.  Its a completely different mentality from stocks where - when a stock goes up - the last thing you want to do is sell it.  Instead you want to hold onto it for it to go higher, right?

When trading options, you need to have a different mentality as follows.  Once a setup occurs and you enter a position, you need to pick a target and take profits when it gets there.

Case in point is Zillow.  Recall the week before I took profits from the move up from 118 when it hit the fire at 124.  The stock quickly pulled back from there.  But just a day or 2 later, the stock was right back up to the fire line so I went long the following Friday 120 calls at 6.20.  I figured the stock would make it at least up to the 128 area so I took profits when the option reached 9.0 which was well short of the snow line at 132.76 but still a decent profit.

As it turns out, Zillow went much higher - further and faster - than I expected.  And notice how it ran right up to the snow line at 132.76 (almost to the penny) then pulled back.  It close out the week at a new all-time high and I would have gone out long some calls but I was too busy doing my regular job to be on the case at the time.  As for further levels in Z, we have the next snow line up at 137.89 and the next tree line up at 147.54.

SCTY was another case in point.  I got involved on Tuesday this past week after that huge bull elephant bar.  That bar was the largest daily range and daily volume in months.  So I went long the next Friday 50 call at 14.95 which corresponds to a stock price of about 65.  The stock sold off the next day and stalled a bit, but eventually headed higher and I took profits when the option hit 18.  I did not expect the stock to reach the tree line by the end of the week, but it did and almost to the penny!

You might look at that chart and say - what's the big deal - you drew these lines in retrospect right?  Wrong - I knew these levels ahead of time and that's the whole beauty of voodoo.  You know where to take profits on spikes into extensions.  It is at these moments of maximum exuberance and confidence by the market participants that you want to unload your positions.

As for next week, I have long positions in NFLX and CMG and I am expecting to see higher prices ahead in both positions now that we have cleared monthly options expiration.  Recall that option expiration tends to keep a lid on things and once the expiration passes, stocks are often free to run up to the next level.

Have a great weekend and a great trading week ahead.

Sunday, June 15, 2014

Active-Trader - 5 Days of Fib - Day 5

Welcome back loyal blog readers.

This is the last in our series 5-days of fib where we cover fib levels for many popular stocks. Since we started at the beginning of the alphabet, its only fitting that we start with end in this wrap-up post.

We start with real estate giant Zillow.  Considering this company still hasn't earned a profit, the stock has been a success rising to a new all-time high this past week after an IPO at $40 back in 2011.

Regarding fib lines, you may ask, do the lines provide an actual usable information when trading?  I can tell you that they do here's how.  This past week, I was fortunate to get long the Jun 21 100 calls at about on 6/10 at about 18.60.  2 days later we had a major breakout and the stock shot up to all-time high territory at about 124.  As this point, confidence was high, the position was well in the money.  But noticing major voodoo resistance, I sold the option at 24.00 on a spike up to resistance.  It wasn't the high of the move, but it clearly formed an area of resistance.  Like magic the stock sold off from those levels and found some support in the low 120's.

As for the voodoo wave 1 levels, Thinkorswim has a handy feature where you can hold your mouse cursor over the 100% area of the Fib retracement and a box pops up showing you the price levels.  Using that, we can see that wave 1 started at about 24 back on 11/15/2012 and ended at about 62 on 5/10/2013.   Once you know that, all of the other voodoo levels are easily calculated using the Fib-Retracements tool.  Using that, we can see that we have some resistance to get through at the 261% line here at 124, but we are still well short of the 423% line up at the 186 price level.  I expect further upside in the shares and went out long the June 21 120 call looking for a spike up this coming week.

Next and last up on our 5 days of voodoo series is restaurant review site YELP.  Cramer calls this company the 'holy trinity' of tech - social/mobile/cloud.  Unlike Zillow, I don't use the service myself, but the stock took a major pop this past week when travel giant PCLN announced it would acquire restaurant reservation company Open Table (OPEN).  I don't use that service either, but I was long YELP and made some money on the pop in the stock.

As for the Fib levels,  wave 1 started at 13.28 on 5/29/2012 and ended at 6/23/2013.  I don't have complete confidence in these levels, but notice how the 161% line - easily penetrated on the way up, became support just being breached to the upside.  For even more convincing evidence, notice how the recent low in the stock (at 49.11) was just pennies below the 161% line at 49.33.  You can't make this stuff up and is further evidence of the power of fib lines in action.  BTW, I went out long the next Friday Yelp 70 call at 6.28.

Looking back at the fib series in retrospect, I didn't even get to the major indices, DIA, QQQ, SPY and IWM.  I expect to cover those in a future post.

Happy Father's day to all the dad's out there and enjoy your day and the rest of the weekend.  And have a great trading week ahead.


Sunday, June 8, 2014

Active-Trader - 5 Days of Fib - Day 4

Welcome back Active Traders and Wealth Builders.

In this post, let's tackle the voodoo lines for Tesla (TSLA).  I struggled mightily to come up with levels that corresponded to a screen shot I picked up in a free video from John Carter from Simpler Options which showed just 2 lines at 274 and 169.  I didn't know which lines these were in the sequence and could not figure out anything obvious from the chart that correlated with these levels.

To unravel this mystery, I put together the above table that shows the different levels in the fib sequence along with relationships between the levels. The sample column shows an idealized wave 1 move from 10 to 20 and the resulting prices for the subsequent levels.  The % Up column shows the percentage change between the prices at that level from the 1.0 level at the end Wave 1. Given that, can you fill in the remaining levels for TSLA?

To figure it out, I took the difference between 274 and 169 and came up with 105.  Note that percentage up between the 4.23 line and the 2.61 line is double (16% to 32%).  So divide the 105 by 2 and you get 52.5 which is the height of Wave 1.  Subtract 52.5 from 169 and you get the 1.61 line at about 116.5.  Now subtract 31.5 (0.61 times 52.5) from 116.5 and you get the top of wave 1 at about 85 and the bottom of wave 1 at about 32.5.  Fine, but do these associate with actual chart levels?

Both Thinkorswim and TC2000 could not help answer this question since they could not provide clear daily charts at times in the past  However Tradestation came through like a champ and I was able to find levels which corresponded with these numbers as shown in the graphic. Using that, I estimate that Wave 1 began back on 3/15/2013 at a price level of 35 and ended at 85 on 5/15/2013.   Note how after a rest at the end of wave 1, TSLA quickly ran up to the 1.618 line and paused, further evidence that we have the correct levels.

Given all that, here is the complete set of Voodoo fire lines for TSLA. The all time high in price at 265 is just beyond the 423% line at 239.  Since then TSLA has been in retreat and the next major support is the 261.8% line at about 181.  That said, I hate TSLA stock on the long side since the valuation is ridiculous at these levels.

Overall, I spent about 4 hours trying to unravel this mystery.  But now that I understand the price relationships between the levels, it will be easier to calculate the missing lines when I just know 2 of the 5 line set.

Enjoy the rest of your weekend and have a great trading week ahead.

Sunday, June 1, 2014

Active-Trader - 5 Days of Fib - Day 3

Welcome back loyal blog readers.

In this post we're going to pick up the pace on our review of the Fib lines and cover all 'usual suspects'. These are the big tech names that get all press because of the high prices and big point moves.

Fib on these charts can be a challenge because the Elliot Wave 1's occurred several years back and many points ago.  To find the Wave 1, you need to go to a monthly chart which is not even offered by default on the Thinkorswim platform.  Not a problem, just add the 10 year monthly time frame.

First up is everyone's favorite search engine Google.  Wave 1 started at the low of the real body of the monthly candle on 12/12/2008 at a price level of 142 and ended on 1/26/2010 at a price level of 312 on 1/26/2010.  Note how the 100% level was resistance for the better part of 3 years and the price did not break about that level and stay above it until the breakout that occurred in 2012.  After that, the price sailed upward and first found resistance - then later support at the 161.8 line at a price level of 417.  Note that the stock has since split 2 for 1 but it doesn't matter since all the price relationships are intact.

How do you know the fib levels are correct?   You often get clues along the way and the way prices reacted to the 161.8% line is a solid clue that these levels are good.  As for more recent price action, the 61.8% tree line line proved to be a good support level and the next major upside target for GOOG is the 261.8% fire line at 587. With the stock price closing at $560, the 587 price level is just a chip shot away and we could see that level as early as this coming week.

Next up is social media stock LinkedIn. Wave 1 started at the low of 56 on 12/24/2011 and ended at 123 on 4/6/2012.  I'm not a buyer of LNKD shares since the valuation is excessive with a PE of 666 versus peer FB which has a PE of about 85 and whose shares are much earlier in the speculation cycle.  I will be looking for potential opportunities to sell call credit spreads when prices approach overhead resistance.

Next up is online travel powerhouse Priceline - PCLN.  Looking at this chart, its hard to tell where to start since the chart has been in an up-trend for so many years.  In fact the low of the chart was 17.42 set back in 2004 and now the stock is at at 1278. That comes to about a 50% per year compound rate of growth which needless to say is a spectacular performance.   In any case, the stock took a pause back in 2012 and went into a corrective 5-wave down pattern.

From here it gets tricky and I have to admit I had a hard time coming up with levels which corresponded to a clear beginning and end of Wave 1.  What I came up with is Wave 1 beginning at a price level of 646 back on 2/18/2013 and ending at 820 on 5/28/2013.  Only problem is that 646 does not correspond to an actual low on the chart. Putting that aisde, the 261% and 423% levels have proven to be excellent levels of support and resistance on the chart, so for now, we'll just go with it.

Bringing PCLN up to date, we have paused at the upper tree line right at about 1276 and after some after we get through that congestion, I expect we will eventually see a new all-time high in the shares.

I also meant to cover Tesla (TSLA) and Zillow (Z) in this review but ran short on time so we'll have to cover those in a separate post.

That's all for now, have a great week ahead and good trading.

Saturday, May 24, 2014

Active-Trader - Welcome iPhone 4s

Welcome back loyal blog readers.

Recently, I finally broke down and got smartphones for myself and family of 4.  Up to now, I have avoided it since I could not justify the $250 per month expense.  After all, don't I have enough screens already?

In the end it was a confluence of events, and i'll spare you all the gory details.  The thing that won me over was AT&T's plan where you get 4 lines, unlimited talk and text and 10GB shared date for $160 a month.  That wasn't much more than I was paying for 4 dumb phones from competitor Verizon.

Sometimes I have to get dragged, kicking and screaming into the present and in this case I'm truly amazed at all the things this device can do.  And just to wrap your head around that, here is a partial list:

- Wireless connectivity - WiFi 1x, 3G, 4G and Bluetooth
- E-mail access to multiple web-based accounts, Yahoo, Gmail
- Live TV at home via Optimum App
- Live streaming traffic and weather anywhere via News 12 App
- Web browsing via Safari web browser
- Social media access via Twitter, Facebook and linked in apps
- Live streaming CNBC anywhere via CNBC app and Optimum subscription
- Access to 1000's of movies and TV shows via Netflix
- Access to nearly any radio station around the globe via Radio apps including my favorite local station 107.1 the Peak via their custom apps
- Access to all the Financial Apps, banking, E-Trade, TradeStation, TD Ameritrade, TC2000
- Access to large corporate e-mail, calendar, notes and contacts using Good Enterprise.
- Still and video camera with photo and video capture and playback
- Full mapping with real-time location awareness on a map
- Live video chatting with family and friends with facetime.
- Automated turn-by-turn directions when traveling - no need for a separate GPS device for the car
- Compass for remote navigation
- Save and play an entire music library, 16 GB is a lot of music
- Text messaging to the world

One last thing I forgot, you can use it to make phone calls.

We are living in truly amazing times.  Enjoy your weekend.

Sunday, May 18, 2014

Active-Trader - 5 Days of Fib - Day 2

Welcome back loyal blog readers.  This is post 2 in my 5 Days of Voodoo series where I will share my interpretation of the location of the Fib lines for popular stocks.

Next up is warehouse retailer Costco (COST).  Wave 1 started at the low of $63.22 back on 8/8/2011 and ended at $80.84 on 12/5/2011. Since then, prices topped out just short of the 61.8% extension of the 281% line at 109.35.  The 109.35 line has served as an important line of support for nearly the past year as you can see from looking at a weekly chart.

COST was a challenge since I could not verify it against any external sources.  The low was easy to identify - TOS does it for you - but there were several interpretations of where Wave 1 could end.  I chose this interpretation since the resulting levels proved to be important lines of support as shown on the chart.

That is an interesting point it itself - if  you think this work is purely scientific and objective, think again.  It may be based on scientific principles - but coming up with the lines is a subjective and often backward-looking process.

Next up in drug maker Celgene - CELG.  Wave 1 began on at the low at $51.70 back on 8/8/2011 and ended at $80.48 on 4/16/2012. Since then the stock topped out just beyond the 423.6% line.  Since then it has been in correction mode like many of the big drug stocks.

I featured CELG in my 4 Horseman of Biotech post back in July of 2013.  Of the 4 horseman, CELG has the highest 5-year earnings growth rate at 32% but with a PE of 47, it is fairly valued.   The entire group is now in retreat and with many buyers trapped at higher levels, I'm not likely to tread here on the long side any time soon.  Instead, I prefer stocks much closer to all-time highs and much earlier in the speculation cycle.

Last up for this week is Catamaran - CTRX.  Wave 1 began at the low of $20.18 back on 10/24/2011 and ended at $32.36 back on 1/16/2012.  Since then, the stock topped out just beyond the 32.8% extension of the 161.8% of wave 1 and has been a complete slop fest since.  CTRX recently found support at the 161.8% extension at the $39.3 level.

Even though the stock is acting poorly, 5 year earnings growth is 34.59% with a PE ratio of 31.95 so the valuation is pretty respectable.  That said, I'm not likely to tread on the long side here anytime soon.

Have a great week and keep your cash levels high since this market is in a stealth correction.