Monday, December 31, 2012

Meta-Trader - 2012 Wrap-up

Welcome Back, Meta-Traders and Happy New Year!

As of this post, this blog is almost 3 years old so Happy Birthday wishes are in order as well.  As promised, here is my year-end wrap-up for the year 2012.

In some ways, I'll be happy to see this year come to an end since it was somewhat of a disaster for my Automated Forex Trading experiment.  The table below shows the status of each account, opening balance, closing balance, and disposition.

In 2012, every Forex account lost money and overall I lost about -26% for the year or about $5200 on a $20,000 starting balance.  In some ways, it was the mirror image of last year where nearly every Forex account made money and I turned in a +16.94% profit for the year.  For a recap of last year's Automated Forex Results, click here

Even more disturbing is that this year's losses exceed last years gains in quantity and percentage terms.  We had some spectacular gains the prior year and in one case my Atipaq Full Portfolio account was up almost 100%!  But that was just before it went into a draw down spiral which took it down -46% year to date and about -17.8% from the start.  That means my entire 3+ years of Automated Forex Trading has been a money losing enterprise and that doesn't make me very happy considering the amount of time I've spent on it.

Based on all that, I came pretty close to throwing in the towel on my Automated Forex career this year. But in my years of trading, I have had flat to negative years, and I take that all in stride.  So I have decided to give it another year and see how it goes.  Another sweeping negative year might shake me out completely.

As for equities, it was an excellent year where I beat the SP-500 by about 4 basis points in my cash account, and lagged by about  213 basis points in my retirement account.  This may not seem like much of an accomplishment considering the positive year we saw in the SP-500.  But I was never fully invested and typically about 30% in cash.  So I achieved my objective which is to generate positive returns with maximum possible protection of capital.  Based on this year's results, I'm well on my way to financial independence.  Now I just need to get the kids through college without wiping out my wealth!

As for 2013,  I'm going to go forward with these accounts:

  • Atinalla No 1
  • Atipaq Full Portfolio
  • Atinalla No 3
  • Sunqu Live
  • Paquarin Demo
Let's see if we can get some positive returns from these systems.

That's all for now and Happy New Year!

Friday, December 28, 2012

Meta-Trader - ESM13

Welcome back, Meta-Traders.

My education as a trader took a big step forward this past week now that I am live on the TradeStation platform.  I have some history with the product since its founding back in 1982 when Ralph Cruz created the first ever product where Trading Strategies could be 1) Described in terms understandable by a trader 2) Back tested against historical data and 3) Executed live in the marketplace.  In the early 1990's, I purchased a product called Super Charts from Omega Research which provides the roots of my understanding whether Automated Trading could make money trading stocks.

Fast forward 20 years and the product has evolved way beyond its roots and now it does all of the above except it now includes Forex, Stocks and Futures.  Earlier in its history, you had to pay $99 per month for access to the platform, but due to competitive pressures, you can get it essentially for free - for non-professionals.  Not only that, trading through the platform is dirt cheap -trades that cost $10 at E*Trade, or OptionsXpress cost $1 (that right one dollar!) on TradeStation.

Its easy to be overwhelmed by all of this information and tools. One of the great features of the platform is when you login you can choose real, or simulated trading.  Simulated trading lets you play around with every feature of the platform but with fictional money.  Platform access includes simulated and separate accounts for Stocks, Forex and Futures which need to be segregated since they are regulated by different entities.

One of the first things I did was pull up a 1440 tick chart of the ESM13 which is which is the March 2013 SP500 E-Mini Futures contract.  Like Forex, this contract trades 24x5 as as a result provides a real-time read on the view on US Equities.  Based on that, I watched the futures after the US stock market close at 4PM EST to see a further sell-off into the close at 4:30 PM EST.   Conclusion:  ES is the real-time 24x5 thermometer of future action in US-Stocks.  That is pretty important in itself since sometimes market moving news breaks outside of market hours.  Lesson #1, watch the futures since they always lead the cash market.

Lesson #2 is the Matrix shown in the upper left corner of this blog.  This single view shows an incredible amount of information for a single tradable.  Its part Level 2 display, showing depth of bid and offers and each price level.  Its also part Market Profile showing amount of trades transacted at each price level as signified by the volume bars on the right side.  The oldest volume is show in dark green while the more recent volume is show in lighter green.  There are also indicators for day high and day low including Volume Weighted Average Price for VWAP.

As if all that were not enough, you can click on the price levels on the left to bid for the stock at that price or on the right to sell short.  Once you have a position, you can submit trailing or fixed stop orders and drag them up and down to make instant changes.  After that you have One-Cancels-Other orders to handle Take-Profit and Stop-Loss orders in a single shot.  Beyond that, you have One-Sends-Another orders so that if an order is triggered due to a Buy or Sell stop, you can kick in another set of stop and take-profit orders. There's no shortage of order handling options.

Enough TradeStation for now.

Those of us following the Fiscal Cliff discussions are pretty much disgusted by the lack of action by our lawmakers.  Despite the sell-off in stocks this past week, the market doesn't seem to care and expects it to be worked on in 2013 with minimal damage to the economy. 

As for Forex, its been a rough year and I have closed a number of accounts.  Expect a recap of 2012 results as well as a plan forward for 2013 by the start of the New Year. Come back early next week for that.

Enjoy your weekend and count your many blessings.

Friday, December 21, 2012

Meta-Trader - Hello TradeStation

Welcome Back, Meta-Traders.

I'm off from my regular job and had a great week trading, doing home improvements and joining free webinars showing live trading from some of my favorite personalities in the business.  This past week was far from typical, but it opened me up to the possibility of a much better future life, more to come on that.

The most significant step forward this week was to open an account with TradeStation Securities.  Recall I have been with E*Trade securities for several years and while I love the platform and the technology, the commission are starting to become an issue.  Looking back at my accounts in 2012, I spent a few thousand on commissions, which seems like a lot of money but just under one half of one percent of total assets under management which is not so bad in the world of Asset Management.

Money aside, I have found that commissions themselves prevent me from taking certain trades.  Let's say I want to enter a spread position with a maximum cost of $115 for a maximum profit of $250 or vice versa.  I would not consider that on E*Trade since the cost on each side would be $10 or more and about 20% or more of the profits!  That same $20 trade with TradeStation would cost just 2 dollars!

As for another case in point, check out the above day-trade in AAPL weekly calls.  Gross profit on this trade was 73 cents or $73 on a one-lot.  After commissions from E*Trade, net profits are $53.  With TradeStation, net profits on this trade are $70!  That's a pretty big difference and over time could make the difference between success and failure in active trading.

On a another note, recall that Tradestaion has its roots in Omega Research which was a founder in the world of algorithmic trading.  There was time back in the 1980's when access to this platform cost a few thousand dollars.  More recently, TradeStation made this platform available for $99 per month.  In my case, the platform is now essentially free (since I am a non-professional) and I still get the $1 for 100 shares or per option contract with no monthly fee!   Sure there's probably a downside, but we will figure that part out later.

Merry Christmas to all to all a good night!

Friday, December 14, 2012

Meta-Trader - 12/12/12

Welcome back Meta-Traders.

It was an historic week to be alive, and the highlight of the week was Wednesday 12/12/2012.

First up, at 12:30 EST the US Federal Reserve released the FOMC statement and - for the first time ever -  tied exceptionally low interest rates to a specific unemployment figure - 6.5%.  Since we may not see that unemployment rate in my lifetime, they essentially indicated rates would be low for an indefinite period! They also increased asset purchases to $85 Billion a month in an effort to keep long term rates at the current "exceptionally low" levels.

All this is of course good for Equities and they market had been expecting this so reacted with a morning rally and and afternoon sell-off, and ended the day essentially flat.   Stocks have had a nice run lately getting my account back to the higher end of the recent range.

Later in the day on 12/12/12 was the Concert for Sandy Relief broadcast live from Madison Square Garden in New York City.  This concert included the greatest line up of rock musicians ever on a single stage including Bruce Springsteen, Roger Waters of Pink Floyd, Bon Jovi, The Rolling Stones, The Who, Billy Joel and Paul McCartney.  Any one of these acts could have sold out the Garden, but they all appeared together interspersed with celebrities and comedy from Billy Crystal, Adam Sandler and others.  And it was all broadcast for free on TV and combined with real time commentary with my Facebook friends. And all for a great cause with all proceeds going to the Robin Hood Foundation for Sandy relief.

I have always had an appreciation for the number 12 since it has a lot of unique properties.  12 is a special number and 2012 has been a pretty good year overall, and this was a rare day, never to be repeated in my lifetime.

And on the topic of Once-in-a-Lifetime-events, we congratulate Daniel Fernandez, webmaster of Asirikuy who is getting married this weekend to his sweetheart Paola Torres.  Best of everything Daniel and Paola, and I will leave you with words spoken to me by the Limousine driver on the day I was married just over 20 years ago:

"What's hers is hers, and what's yours is hers".

On a final note, I finished with my real job for the year and ready to reap the fruits of my labors and live off the fat of the land.

Happy Holidays to All!!!

Sunday, December 9, 2012

Meta-Trader - Webinar gone wild

Welcome back, Meta-Traders.

This past Friday December 7th, I had a chance to join a Webinar hosted by Infinity Futures which was structured as a live trading challenge.

On one side was Hubert Senters (one of my favorite trading personalities) trading Bond Futures and Gold Futures.  On the other side was Brian Rehler, trading mini S&P Futures and Euro Futures.  Note that it was Non-Farm Payroll Friday, and we had a good number so it was a better than even chance things would be moving.  We also had a Consumer Sentiment number due at at 10AM EST.

To make a long story short, they both lost money!  Hubert lost about $550 getting stopped out of both Bond and Gold trades.  Brian lost less - about $200 on a single E-Mini futures trade.  I think both traders were constrained somewhat by the circumstances (2 instruments only 90 minutes) and pressed to trade something since winning by doing nothing wouldn't be much of a show.

In going through the process, Hubert revealed some of his rules, one being after he loses 3 times in a row on a single instrument in a single day, he stops trading that instrument for the day.  He also indicates he usually stops trading by about 11:30 EST regardless.  This performance was different from one I attended the Friday after Thanksgiving in 2011 which was totally hosted by Hubert, and he did make some money in that challenge.  

Altogether the challenge highlights how hard day trading is, and you have to expect a low winning rate and be completely un-rattled by losing money.   Hubert indicated he makes most of his money on longer-term swing trades, and something to the effect that he makes all of the years money in 3 months and spends of the rest of the year trying not to give it back.   Its similar to what I've found in my own trading where most of the money is made on just a few trades, but you need to stay in the game and pay attention, otherwise you will miss out on those big trades when they happen.

And speaking of my own trading, I took profits in Facebook (FB), and added a new position in Pharmacy chain BioScrip (BIOS).   On the currency side, I gave back all of last weeks profits and went into the negative.   But I didn't lose much money and stuck with my plan which is what counts.  I didn't find market conditions to be suitable for that type of trading.

On the Automated Forex Trading side, Atinalla #1 is on a bit of a winning streak, but the remainder of the accounts went to new lows.  I already liquidated the COATL H1 account, and the Atinalla Custom account will also be back to cash by the end of 2012.  I'll be glad to see 2012 draw to a close on the Automated Forex side and we are looking for some Neural Network based systems to show some performance in 2013.

That's all, enjoy your week.

Friday, November 30, 2012

Meta-Trader - Threading the Needle

Welcome Back, Meta-Traders.

This was my 2nd full week of live trading the 5-minute bars with the Triple-MA Crossover method described here.  I didn't make a lot of money, but I came out in the positive thanks to a short trade in AUD/USD on Thursday shown on the left which highlights a few key elements of the method as follows:

- Go with the trend which in this case was down.  Its hard to see from this small chart and would be that much more obvious on a larger chart.  But the 50-bar (purple) MA clearly shows a downtrend.

- Wait for the price bar to straddle all 3 moving averages like we see above.  This prevents us from entering when the price is too far extended in either direction and due for a snap back to the moving average.

- Do not enter unless the stop is close - in my case no more than 10 pips but generally under 5 pips. Signals bars with large bodies are not good because the stop is too far away.

In the above case, I sold AUD/USD at 1.04396 with a stop at 1.04440 - just 4.4 pips away.   I closed the trade 14 minutes later right about at the bottom of that huge bear elephant bar and took profits at 1.04257 for a 13.9 pip profit.  The take profit was about 3 times the size of the stop loss which is a good risk to reward ratio.  It takes patience and and waiting for the right entry is somewhat like threading a needle.

Also, it remains to be seen whether I have just been lucky or I can really trade like this consistently week in and week out.  But I'm having fun and you can follow my live trading results on the Sunqu Live link shown above.

And speaking of fun I had a pretty good week in equities with new positions in Facebook (FB) and Research in Motion (RIMM) which are both showing signs of life after big sell-offs.  Also an e-mail from a blog reader caused me to dust off the "New High, Low PE, High Growth" TC2000 scan.  Based on that I picked up some EBAY which hit new all-time highs a few times this past week and has excellent fundamentals with a 5-year earnings growth rate of 57% and a PE of under 17!  The smart money is rotating out of last years winners like AAPL into next years winners and EBAY has all the makings.  We'll see.

On the Automated Forex Trading side of things, I am in the process of cashing out some of these losing accounts.   Based on the results of Automated Forex Trading this year, I could easily get depressed, about the year's results.  But in the larger scheme of things, I haven't lost all that much money and good money management is a matter of rewarding success and punishing failure.  Its not much more complicated that that.

Finally, I want to leave you with a quote from Benjamin Franklin, one of the founding fathers of the United States of America:

"Diligence is the mother of good luck".

That's all.  Enjoy your weekend.

Saturday, November 24, 2012

Meta-Trader - 1 in 137

Welcome back Meta-Traders.

My education as a Forex Trader took a positive step forward this past week with my first week of live, manual trading. I didn't  make a lot of money, but the results were positive and I think I am finally on track with my Forex trading.

There are probably at least 137 ways to lose money trading Forex. I have wiped a few Forex accounts to make it to this point, and this year's results are a case in point.  But I suspect you are reading this blog to find out what works with Forex trading.  So here are the basics of what I have found:

  • Don't trade all the time!  Trade only during active, prime-time hours for your pairs.  For me, that means about 6 AM to 12 Noon EST for my favorite 4 pairs.  Don't trade during semi-holidays or any other time when all the players are not on the field.
  • Review each pair from higher to lower time frames.  Get the feeling whether they are going up or down. Stick the day's directional bias into your head for each of the 4 pairs. 
  • Go to the M5 and overlay the Triple-MA template and the MA-Clusters indicator I uploaded in last week's post.  These 3 moving averages bring a world of clarity to just about every chart.
  • Avoid spiking, ranging or otherwise uncommitted markets.  If its not clear to you what direction the pair is taking, just avoid it and wait for clarity.

Those 4 items alone will eliminate a huge amount of bad trades and reduce the failure space from say 137 down to about 63.   If the price bar is not straddling all 3 MA's or at least 2 of the 3, don't consider entry.  The arrows in the MA-Clusters indicator will only draw when the price bar straddles all 3 MA's.  I've also found that once a good trend is going straddling just the 5 and the 20 can yield some pretty good results.  Case in point in the chart of the left of AUD/USD which showed a good pullback to the 20-bar MA with a good, solid entry bar in the middle which straddles the 5-bar and 20- bar MA. Note how price found support at the 20-bar MA and continued in its prior direction.

Once you get a signal bar, you have another 5 minute bar to decide whether to take the trade.  Once you enter,  place your stop loss a few ticks on the opposite side of the signal bar.  For good entries, your stop should be not too far away, certainly less than 10 pips but typically closer to 5 pips.  Once the stop loss is in place, walk away for a few minutes and just let things play out.

If you have done everything properly up to now, you just need to wait to make the spread and for it come into profit.  When to take profit is the hardest part and I need to learn patience.  Generally speaking we are going for a profit 4 to 5 times the range of the signal bar.  I need to learn patience and learn its okay to take a  losing trade and be able hang on long enough to let a big winner develop.

Following this method this past week, I took 3 trades and won on 2 of the 3 and took home about 8 pips or about 88 cents trading 0.01 lots.  It's just a small start and you can follow the results in my Sunqu Live account link found in the upper right hand page of the blog.

One last thing about this method that works for me is that I don't have to spend my evening and weekends trying to program a winning Forex system.  Instead, I can worry about trading during trading hours and live my life on the weekends.  So it makes for a better work-life balance.

That's all, enjoy your weekend.


Saturday, November 17, 2012

Meta-Trader - Almost time for Reset

Welcome back, Meta-Traders.

With 2012 drawing rapidly to a close, its a good time for some strategy and planning.  Clearly, it has been a disappointing year for our Automated Forex Trading experiment.  We are approaching the end of year 3 of my 5 year plan.  After putting together a 16.94% return in 2011, we have taken about a 25% hit in year 3. I started the year with about $20,000 under management and as of today, I an down to about $15,000 so I have taken about a 25% loss overall for the year.

What's more disappointing is that the losses have come nearly across the board with nearly every account taking a shellacking.  And the only ones which did not get crushed are the ones which I stopped after initial losses. What's even more depressing is the fact that the losses I have taken this year wiped out my profits from year One and put the entire Automated Forex Trading experiment into the negative.

But nearly all asset classes have losing years and that's why we hit the Reset button once per year when managing our assets.  This allows us to wash our hands of whatever worked, or didn't work for the prior year.  It also gives us a chance to take stock of our situation, and re-balance funds as needed.   So between now and the end of the year, we will plan our asset allocations and get the funds lined up so we are ready to start trading the 1st of the year.   This is key since the first 10 days of the year are often explosive in Forex Trading capturing a disproportionate amount of the year's gains.

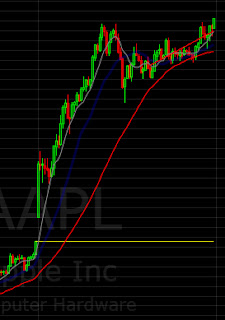
As for Equities this week, Apple had a big move on Friday trading down to as low as 505.75 intra-day, then (along with the rest of the market) staging a dramatic V-shaped reversal at about 11:30 AM.  This was right about when congressional leaders emerged from a meeting with the President with conciliatory language all around indicating the 2 sides were perhaps not so far to agreement to keep the US from falling off the fiscal cliff.  Also, notice from the chart that this is the 8th weekly down bar for Apple computer, and as Oliver Velez points out, things often happens in 5, 8, 13 and 21 bar patterns.  So Apple and the entire market are more that a little oversold, and discounting the worst case scenario from the fiscal cliff negotiations.  I used this opportunity to pickup a small amount of shares after having sold a few weeks back at about 608.

This coming week I'm going to start live trading 0.01 lots of my 5-minute intraday scalper system.  For more information on this system, see my post from a few weeks back 5-Minute Bar.  Along these lines, I uploaded to my blog these 3 files in a single file called 5-Minute-Bar.zip as follows:

Fx-Ma-Cluster.mq4 - Place into .\experts folder
MA-Cluster.mq4 - Place into .\experts\indicators folder
Triple-Ma-Template - Place into .\Templates folder

This system is based on the premise that you can do semi-automated intra-day trading on 5-minute bars on active pairs, EUR/USD, USD/CHF, AUD/USD and USD/JPY.  Check back next week to see how that worked out.

That's all, enjoy the rest of your weekend and have a great week ahead.

Sunday, November 11, 2012

Meta-Trader - Out of the Dark

Welcome back, Meta-Traders.

After a 12-day ordeal, my power has finally been restored. I owe a debt of thanks to the local village government who opened the municipal building 24x7 for warming, charging and bathrooms. Also our friends, family and neighbors all pitched in to help me and my family through a difficult situation.  I will never be quite the same and its a healthy reminder to be grateful for all we have in our lives.

Now back to the markets.  My Forex robots laptop has been down hard since about 7PM on 10/29/2012.  Looking back over that period, I missed about a 1% gain in Atinalla #1 and Atipaq Full Portfolio, and about a 6% gain in Atinalla #3 based on performance from some accounts in Asirikuy.  Results vary of course and I don't regret the decision to avoid the cost of a VPS. Someday perhaps when Forex robots prove their mettle, but I'm not there yet.

By this past Friday, things were normalized enough that I could take a look at the markets with an eye toward some trading opportunities.  My favorite stock Apple Computer has taken quite a round trip, from a high of $705.07 back on 9/21/2012 to Friday's closing price of $547.06.  That's about a 22% selloff and quite a reaction from the high.  And during this period, iPhone 5 sales were ramping, and also the recent release of the new iPad mini is doing well. 


Looking at the chart,  there's near perfect symmetry in this move with the stock finding support at the 45 degree line on the way up, and find resistance at the 45 degree line on the way down. After finding support briefly at the take-off point on the way down, the stock gapped down and plunged to a new 4-month low. Friday's action seemed to try and find a base putting in a daily low at 533 and a daily high at about 554, over a 21-point range!

This made for a some good trading opportunities and I was back to my old ways, buying the November 17 530 call and for about $2160 looking for a quick move up to $3000.  I didn't get it, but I was able to exit the position with a gain of about $200 within a few short hours.  With a stock making 20 point moves in a day, you know there are trading opportunities there!

I am continuing in my new vein of making trading an active pursuit during the trading day, versus a scientific approach on the weekends.  Of course there's plenty of opportunites for good computer-based analysis and the weekend is a great time to do it.  But I am no longer in the mindset that I can make a living with algorithm-based trading, and least not from the profits.

Good trading is all about studying the markets, being right on direction and timing, picking entries, cutting losses and letting the winners take care of themselves.  After all, good trading is not rocket science.

Have a great week all and count your blessings.

Saturday, November 3, 2012

Meta-Trader - Slammed by Sandy

Welcome back Meta-Traders.

Its been a rough week for your humble blog author.  Hurricane Sandy came through the NY Metro area Monday evening, and I lost just before 7PM Monday evening.  As of Saturday, power still has not been restored and the indications are it may not be back for another week.

Soon after the power loss, I got the Forex robots laptop onto the Internet via cellular Wi-Fi and closed all open positions.  So Forex has been down hard all week.  Here's one case where I could have benefited from a VPS, but its cost would have only put me deeper in the hole on Automated Forex Trading.

The local municipal building has been open 24x7 and they have power and working bathrooms which is a plus since my house has no pressure left in the water system, so we can't even run water to wash hands.  Toilets can be flushed by only by lugging pool water in via buckets and dumping it into the toilet tank.

As if all that were not enough, gasoline is now in short supply and long lines are forming at stations wherever gas can be found.  We expect that situation to ease in the next few days however but some people are stocking up just in case which only makes the situation worse.

By all accounts, things are worse in New Jersey which took a direct hit from the storm and is more densely populated than where I live.  And the people who live in the high-rises is lower Manhattan are going to have some stories to tell since living in the city with no power has to be a major challenge. Where I live, many stores and supermarkets never lost power and getting food and drinking water has not been a problem.

But every crisis has a positive side.  Despite the loss of life and property damage, this storm will lead to an increase in economic activity.  The landscaping and tree repair crews are cleaning up, both literally and financially.  I will be making a few purchases when my power comes back that I would not have otherwise.  And those whose houses and properties were destroyed will rebuild - at the cost of the insurance industry and at the benefit of the housing industry.  And housing construction benefits everyone from the construction crews and their families to the suppliers via the invisible hand of Adam Smith.

That's enough for one week Meta-Traders.  Health and Happiness to all and a special congratulations to Daniel Fernandez who got engaged to his sweetie Paola Torres this past week.  All the best, Daniel!

Sunday, October 28, 2012

Meta-Trader - The 5-minute bar

Welcome back, Meta-Traders.

This past week I came to an important realization regarding trading the Forex market.  Up to now I have been convinced that we can approach Forex trading as a science. In other words, we can apply a set of algorithms and indicators to the Forex market and pull steady profits from the markets while we go about whatever else we do for a living.

What I have realized instead is that if we want to make our daily bread in Forex we have to treat it as a practice.  What I mean is that doctors, dentists, electricians, plumbers and computer programmers go about their business on a daily basis.  At the end of a day's work, hopefully they have something to show for their efforts.  Very few people in those professions expect their work to go out and produce profits without their direct intervention with the possible exception of business owners.

Put another way, I don't know anyone making a living based on the profits from Automated Forex Trading,  I'm sure someone somewhere in the world of high-frequency trading is doing so, but those people are not about to include us in their efforts. Taking it down to a practical level, here's what I propose:

- Trade only during active market hours say from 6AM to 12 noon Eastern time

- Stick with highly active, low spread pairs such as EUR/USD, USD/CHF and AUD/USD.  Avoid higher spread pairs such as GBP/USD and GBP/JPY.

- Run an Expert Advisor which take entries on 5-minute bars using the moving average cluster indicator configuration discussed a few weeks back.

- Stop out of a position once it breaks below of the low of the signal bar for longs, or below the high of the signal bar for shorts. This means you should never lose more that the range of the signal bar, plus the spread plus slippage.  Make no exceptions and cut losses without hesitation.

- Do not consider taking profits until the position moves at least 2X the height of the signal bar plus spread.  Ideally, we are looking for a "runner" where the position moves many times the height of the signal bar.

- Generally speaking, stay with a position as long as it in profit and the MA5 stays above the MA 20 for longs or below the MA 20 for shorts..   Also consider taking profits once they exceed 2-3X the size of the signal bar, or by 11AM since day traders are looking to unload profits for the day by that time.

Following such rules, I had a decent week trading a demo account with dime pips or 0.01 lot size. Should this method further prove to be successful, I will switch to a live account with low lot size and move up based on further results.

What I like about this method is that it usually enters positions automatically several times early in the day and often in the direction of a major break.  The losses take care of themselves, but more often than not, the winners run and run big until later in the morning.  Also, I have found that they markets sometimes make a false break in one direction or the other, the real move of the day does not get under way until after 9:30 AM EST.

The trade in the screenshot above above is an excellent example in AUD/USD on Friday.  First we had a sell signal which got stopped out for a loss of 78 cents.  Next, we had a buy signal where the range of the signal bar was 6.5 pips and it turned out to be a "runner" and was closed for a 42.1 pip profit or 7 times the height of the signal bar!

Once noon eastern time comes, shut down your Meta-Trader program and turn on CNBC's Fast Money Halftime report to see what's going on in equities.

Note that much of this system can be automated, and I already have an EA which handles the entries and the stops, and leaves the take profits to the operator.  The EA needs further refinement, and will be free to my blog readers of course so stay tuned for that.

As for our other Forex accounts, things are looking up and I dare say we are on a bit of a winning streak in the Atipaq Full Portfolio and Atinalla #3 accounts.  On the negative side, a system system which I started trading back in August called System-U (which I haven't talked about yet) has been stopped for the year since it exceeded at -10% equity stop loss. I will likely restart that system in in early 2013 since it has an excellent historical track record.

That's all, have a great week and stay tuned for further results.

Sunday, October 21, 2012

Meta-Trader - A Downhill Slide

Welcome back Meta-Traders.

This past week was ugly in world markets and it was capped off by Friday's -2% plunge in the major indices.

Leading the parade lower was IBM which noted mixed results on "disappointing revenue".  The stock gapped down -2.5% on the next day's open and has given back nearly 10% since.  Then on Thursday Google accidentally released (disappointing) earnings early and the stock lost about 50 points or 7% in a matter of minutes before the stock could be halted.  Even technology giant Apple has been in a steady downtrend and has sold off nearly 12% from its recent all-time high set less than a month ago.

Keep in mind that its October and this type of sell-off is typical for this time of the year.  In fact, this Friday was the 25-year anniversary of the October 1987 stock market sell off.  I went into October (and September also) with a high cash position, so most of this years profits have already been booked.

The only exception was AAPL which I rode down all the way from the top, although only with a small number of shares.   There's some indication that results could be constrained by supply issues with the iPhone 5 which otherwise has been a runaway hit.  This coming week is going to be an exciting one for Apple shareholders with a press event on Thursday when they are expected to release the iPad Mini (dubbed the Amazon Kindle killer).  Also, Apple earnings are due for release after hours on Thursday which should make for some fireworks.

And speaking of disappointments, Automated Forex Trading has continued its disastrous slide with fresh equity lows in every system.  My Atinalla custom account just crossed down 50% from the account opening.    I recently tried a different set of parameters on USD/CHF which have been profitable year to date, but not profitable historically.   That change only accelerated the slide with 2 large losers and one smaller winner.  I'm taking Daniel's advice and stopping my USD/CHF instances in my remaining systems.

Professional Trader Dan Zanger once said that all stocks are bad, and they are only good when they are going up.   I think the same can be said of Forex systems as well.  I think us Asirikuy members have been schooled into thinking we have to sit through long periods of draw down, but I don't think any professional traders (except maybe mutual fund managers) operate like that.  Profits have to be realized, captured and protected, otherwise the market will take them away just as sure as it gave them to you in the first place.

I think the next few weeks are going to have some great opportunities to day-trade options.  Protect your profits and keep your position size small until the market tips its hand on direction.  Then go in for the kill.

Have a great week.


Saturday, October 13, 2012

Meta-Trader - Equity Account Protection

Welcome back Meta-Traders.

What is single most important job of any Trader or Investor?   Protecting your capital of course!

So many new traders come to the markets under capitalized and with high expectations. Their high expectations are soon dashed when, due to poor loss control, their accounts are decimated.

And it doesn't matter how good a trader or investor you are, or how good your system is, because once your account sustains a 50% loss, its takes a 100% gain just to get back to even!

Admittedly, we have been doing a poor job of loss control with our Forex accounts. Asirikuy doesn't offer much help in this regard (as I understand it) because the overall recommendation is to stop trading a system when its draw down from an equity peak exceeds the Monte Carlo worst case scenario which is in excess of 50% for many portfolios.  In addition, it does not cover the issue of when to start trading systems again once they reach the worst case scenario.  After all, if a system has lost 60% or more of your funds, why would you want to trade it again?  So we end up with a scrap heap of discarded systems and no way forward in the world of Automated Forex Trading.

My initial approach to this challenge was to vary the lot sizes according to performance such that lot sizes are  decreased as equity falls and increased as equity rises.  This way we could trade a variety of systems and they could either succeed or fail based on their own merits. I haven't given up on this approach entirely but initial tests were not favorable since, once the system went into draw down, the lot sizes were reduced.  This reduced the system's ability to climb out of draw down, and thus increased the rate of both failure and success.  We ended up with a situation where draw down was reduced, but profits were also reduced such that we could achieve a more favorable outcome by just reducing risk.

After further consideration, I came up with a few simple equity-based account trading rules as follows:
  • Stop trading a system once Account Equity falls below -10% for the year
  • Stop trading a system once Account Equity falls -10% from the highest equity high experienced in that calendar year
  • Once a system is stopped, restart it on the first of the following calendar year
To see how this works in practice, let's take a look at a system I whipped up recently called FxMaCluster which takes a position once we get a price bar which straddles both the 8, 21 and 50 period moving averages.  For a more complete explanation, take a look at this post: Moving Average Clusters.

This chart shows a 12-year back test without the equity stops applied.

We had some great years, but we also had some terrible years including draw downs exceeding 30% in 5 out of the 12 years in the test.  For example, if we started trading this system at the beginning of 2007 and stuck to the end of the year, we would have experienced a 32% loss of our equity which would require a 60% gain the following year just to get back to even!

To implement the 10% stop loss rule, we added this code to our system:


// Equity calculations here
if (dStartingEquity == 0.0)
{
   dStartingEquity = AccountEquity();
}

// Current Equity
dCurrentEquity = AccountEquity();

// Equity cutoff
dEquityGain = dCurrentEquity - dStartingEquity;

// Calculate the loss as a percent of starting equity
dEquityPct = dEquityGain/dStartingEquity;

// Check for equity stop out
if (dEquityPct < -0.10)
{
   Print("Stopped due to breakdown from open", dEquityPct);
   return(0);
}


We added similar logic to stop out once we exceed a 10% loss from the equity high.  After these adjustments, we arrived at the following 12-year back test results.

First observation is that draw down never exceeds about about 12% in any given year.

Second observation is that average profit is almost cut in half, but draw down is reduced to an even higher extent.

Third observation is that in every single year, we hit the 10% loss from either the starting value or from the equity high of the system. Notice however, that we hit the 10% stop from starting equity only one of the 12 years. In the other years, we went to some level of profitability  but ended up stopping out once we fell down 10% from that equity high.

While overall profitability is reduced, overall survive ability is increased since our odds of surviving a devastating loss of equity are improved.  Granted, this is just one system, and one stop loss value and with a different set of systems, and different stop loss values, we could have a complete different result.  But the system does introduce a stop loss discipline into forex system trading which is a much needed addition.

One final point that I would like to make is as follows. Previous research on the topic has shown that the early part of the year, particularly the first few weeks of the year show high levels of trend behavior in Forex markets.  As a result, Forex trading systems have a higher propensity to produce profits in the first few weeks of the year than in any other time of the year generally speaking.  Therefore, if our system has a chance of making a profit, is has a higher chance to do so in the first few weeks of the year. Once a system has moved into profit, we have a higher change of surviving a draw down and being able to hang on for a much larger gain as we saw in 2004.

One final point is the following.  For the past few years, I have been in search of the Holy Grail system which will produce regular profits much higher than draw downs.  What I have found, is that despite what back tests show, such a system does not exist and we must be prepared for the worst case scenario at all times if we wish to survive in this business.

Final realization is that Forex is no a road to riches, its just another asset class to be considered along with Stocks, Bonds, Commodities, Real Estate, etc, etc.  Granted we have a better degree of loss control in Forex versus other asset classes, but only if we choose to exercise that loss control.

Next step is to implement the stop loss discipline inside the scrap heap of systems I have tested and discarded to see if it makes them worth trading.  Also worth a try is to see if implement this stop loss discipline inside the Asirikuy systems reveals any interesting conclusions in term of whether they are worth trading when equity stops are enforced.

Have a great week.

Sunday, October 7, 2012

Meta-Trader - Analyzing Account Equity

Welcome back Meta-Traders.

When last we left off, we were considering the analysis of account equity.  The objective of this exercise is to analyse the recent behavior of our trading system by examining the actual trading results.  Our goal is a money management scheme that works as follows:

- If a system is behaving poorly in current conditions, reduce the lot size or stop trading it altogether

- If a system is behaving in a neutral fashion, neither gaining or losing money, we can continue to trade it with standard lot sizes.

- If a system is behaving well under current market conditions, then we can go ahead with the full market exposure.

When this method is working properly, we can be trading (or monitoring) a whole crowd of trading systems and having the systems automatically scale into systems which are working and scale out of systems which are not.  Keep in mind that this method will work only for systems which trade frequently, and make (or lose) their money over a series of trades.  It will not work for long term trend followers which may have say 9 small losses and make it all back on the 10th trade.

Looking further into this, I found that Meta-Trader does not have functions which allow tracking of historical account equity.  However, there is a function called AccountEquity() which does just that and spits out the AccountEquity at any given point in time.  Fortunately, this function works as expected whether running live or in back testing mode.

Next, we have a series of functions which can determine (for any given magic number), how much money that instance made or lost as follows:

double OrderHistoryProfit(int nMagic)

int i;
int nOrders = OrdersHistoryTotal();
double dProfit = 0.0;

for(i=0; i < nOrders; i++) 
{
  if (OrderSelect(i,SELECT_BY_POS,MODE_HISTORY)==true)
  {
    if (OrderMagicNumber() == nMagic)
    {
      dProfit = dProfit + OrderProfit();
    }
  }
}
return(dProfit);
}

This function takes a system's magic number (set inside your EA or in the EA Properties) and returns the total amount made or lost.  You might think that the total amount of money made or lost is a poor indicator of whether we should be trading the system.  On a long-term basis, I agree.  But on a short term basis (say the systems last 5 to 10 trades, it could be a good indicator of how well the system is performing.  If you don't agree, take a look at the equity graphs of the systems I have been trading live for the past few years.  Its clear to be that those systems have long, sustainable equity trends.

With this function, we can continue last week's thought experiment and adjust our lot sizes dynamically based on recent performance.

Unfortunately, that's all the time I have for this week.  Check back later and have a great week.


Saturday, September 29, 2012

Meta-Trader - Performance Based Lot Sizing

Welcome back, Meta-Traders.

Albert Einstein once said:  "The measure of intelligence is the ability to change". This quote really rings true since I'm more convinced than ever that the only way we are going to make any profits (and not end up giving them back) is to make systems which are adaptable to recent market conditions.

Case in point is the chart on the left which is a reconstructed equity graph of Atipaq Full Portfolio, which I have been tracking for nearly 2 years on the right side of the blog.  Note how the system started to rally right from the start and peaked (up nearly 100% from the start!) back in March of this year.  Since then, its been a straight slide downward and the system has now given back all of its gains and remains above positive only because of a deposit made back in March of 2012.

We know that the pair behind these losses - and behind much of the losses in my other portfolios -  has been the Atipaq USD/CHF instance.  Historically, this has been one on of the most profitable instances and is why I trade it in 3 of the 5 live accounts I'm tracking.  But up to now, I have been at a loss to explain what's behind the poor performance. Yesterday, Daniel Fernandez cleared it up in a post when he identified the problem as the year-long commitment from the Swiss Central Bank to prevent the EUR/CHF to fall below 1.20 level to stem runaway rally in the Swissie.  Since then, the pair has basically flat-lined, with the Swiss Central Bank coming  in with unlimited funds to prevent any meaningful breakdown of EUR/CHF below 1.20 level which has a related affect on USD/CHF and makes it behave more like EUR/USD.

This move has completely changed the dynamic in USD/CHF and caused a failure of our Atipaq USD/CHF instance.  But what can we do about it?  Its easy to see in retrospect what happened, but how can we guard against these type of changes in future systems?   I thought about it and came up with the idea of varying lot sizes based on recent performance of the systems.  Here's how it works:

  • Track the equity of the portfolio as a data series D
  • Calculate a 5-period moving average of portfolio equity as MA5
  • Calculate a 21-period moving average of portfolio equity as MA21
  • If D is greater than MA5, set M1=0.5, otherwise set M1=0.25
  • If MA5 is greater than MA21, set M2 = 0.5, otherwise set M2=0.25
  • Set M3 = M1 + M2
  • Multiple the baseline lot size (say 1%) times M3 to get your adjust lot size
  • Calculate the new equity portfolio as data series D1

At the end of this calculation, M3 will be a value between 0.5 and 1.  Multiply M3 times your normally expected lot size for the system.  I did a "thought experiment" using this system on a spreadsheet and came up with this adjusted equity graph:

The adjusted equity graph shows the following:

- Identical starting account size at $2100

- Peak valuation for the original series at $4396 versus  $4050 for the adjusted series

- Current valuation for the original series is $2297 versus $2736 for the adjusted series

Bottom line is that the adjusted series results in lower equity highs, but also lower draw down.

In this experiment, the lot size change was simulated in a spreadsheet outside of MT4.  In a true implementation, the logic would be inside the EA and would look back on the account equity and make the lot size adjustments on the fly.  Once that's done the return and draw down statistics can be compared "apples for apples" versus the spreadsheet method which is a construction.

Adjusting lot sized based on recent performance is just one potential method of making systems adaptive.  A more powerful idea would be a system which either buys or sells breakouts, depending on which method has worked recently.  A similar method would potentially have been able to adapt to the complete change in character of USD/CHF.

As always, more to come.  Have a great week.

Sunday, September 23, 2012

Meta-Trader - Moving Average Clusters

Welcome back Meta-Traders.

Taking a page from the Oliver Velez material, I recently setup my charts with 3 moving averages, 5, 21 and 50 periods.  I setup the colors with pink for for the 50-period, blue for the 20-period and red for the 5-period.

This is a great combination of indicators since the pink line gives you an excellent idea of the underlying trend, the blue the intermediate trend, and the red line the shortest time frame hugging the price and always leading the other 2 MA's in the direction of the price.   The indicators work well with nearly any time frame for the chart,  but my favorites are M5, M30, H1 and D1.

Next, I noticed that good trading opportunities often occur when all 3 moving averages are bunched up close to each other, along with the price.  Thinking of how to turn this into an indicator, and possibly a trading system, here's what I came up with:

double dMA5 = iMA(NULL, 0, 5, 0, MODE_SMA, PRICE_CLOSE, 1);
double dMA21 = iMA(NULL, 0, 21, 0, MODE_SMA, PRICE_CLOSE, 1);
double dMA50 = iMA(NULL, 0, 50, 0, MODE_SMA, PRICE_CLOSE, 1);
 
/* Lowest of the 3 MA's */
double dLowest = MathMin(MathMin(dMA5, dMA21),dMA50);
 
/* Highest of the 3 MA's */
double dHighest = MathMax(MathMax(dMA5, dMA21),dMA50);

// Grab bar high and low
double dBarHigh = High[1];
double dBarLow = Low[1];

// In Range action
bool InRange = (dBarLow <= dLowest) && (dBarHigh >= dHighest);

In other words, we had to have a single price bar whose low was lower than the lowest of the 3 MA's and whose high was higher that the highest of the 3 MA's.  Put another way we look for a single price bar that straddles all 3 MA's.  The result is an indicator call MA-Clusters with arrows show. above.  The chart above shows a buy signal on Thursday 9/20/2012 with a sell signal a bar or 2 later that led to a nice downward move in EUR/USD.

The signal direction comes in the direction of the price close.  In the example above, we had a lower close, so this would be a sell signal.   Stop loss for the trade would be the opposite end of the signal bar.  In other words, if you took the sell signal above,  the stop loss would be right around where the red arrow is located.  There are several ways to take profit, one is to stick with the trade until you get a close above the 5-bar MA.

The next step was to turn this into an Expert Advisor to see if the system had any merit as an Automated Trading system.  After all, automated trading is what this blog is about, right?  To simplify the system, I used a fixed number of pips for SL and TP.  For the tests below, I used a stop of 55 pips and a Take Profit of 150 pips.

What I found from testing is that the system has some decent recent performance.  On a year-to-date basis, the system is up about 20% with maximum draw down of about 18%. But the system does not appear to be profitable on a stable basis over longer periods of time and therefore seems to have more merit as a tool for manual trading.  Perhaps with more work, it can be turned into a long-term profitable Expert Advisor.

You can find the attached files: ma-cluster.mq4 indicator file, FxMA-Cluster.mq4 expert advisor file and year to date back test files attached to my Yahoo group in case you want to play around with it.

Have a great week.

Saturday, September 15, 2012

Meta-Trader - Don't fight the Fed

Welcome back, Meta-Traders.

It was an historic week in world markets. We had 3 huge developments with macro level implications as follows:

- On Wednesday the German high court ruled in favor (or at least not against) Angela Merkel's agreement with European Central Bank's plan championed by (Mario Party) Draghi to print large quantities of Euros to buy EUR denominated bonds to reduce pressure on Spain, Italy and other sovereign's under duress.

- Later on Wednesday, my favorite stock and world's highest capitalized stock Apple Computer announced the 5th generation of their popular iPhone smart phone.  By all counts, the product is a hit, lighter, thinner and with a higher resolution screen.  Throw in new 4G networking and the accolades came in from all angles.  Apple stock rallied on the day of the announcement and also on Thursday and Friday closing Friday at an all-time high of about $691 a share adding about 16 Billion in market cap for this week alone.

- The big bomb dropped on Thursday at 12:30 PM when the US Fed issued their interest rate decision ending weeks of speculation and hint-dropping with key highlights as follows:

1) New stimulus program centered on Mortgage-backed securities pledging to buy 40 Billion (that's right billion) of Mortgage bonds per month.  They also indicated this position was opened-ended, and they would continue to buy bonds as long as necessary until the economy improved.

2) The Fed indicated they would keep interest rates between 0 and 1/4 of 1% until late in 2015.

3) The Fed also indicated they would not be in a hurry to tighten policy and would remain accommodative well after the economy starts to show signs of strength.

Well this was all the Fed bulls could expect and was quickly tagged by the financial media as the most fiscally accomodative statement in the history of the Federal Reserve.  This was all it took to light a huge rally under stocks on Thursday which had already rallied significantly for weeks into the announcement.  Uncle Ben promised big action and he delivered beyond expectations.

Asian stocks also loved the news on their Friday session which ignited another rally in US Stocks on Friday pushing the Dow Jones 30 and the S&P 500 up to 4+ year highs and within a few percentage points of the all-time highs set back in 2007.

All this bullishness sent currencies rallying with across the board dollar weakness and a capping a huge week in EUR/USD which was in solid rally mode all week, even before the Fed Announcement.  2 of my 5 currency accounts had solid gains for the week.  But extreme volatility in the Atipaq instances took profits from those accounts and gave back some recent gains.

Its no doubt and free and easy money is here to say and tighter monetary policy is a long way off.

Not much happening on the development side with currency trading since my regular day job, college search and household responsibilites have me hemmed in.  But we had a great week in markets on top of an already great year.  So we'll take it for now and live to trade (and code) another day.

Have a great week.

Saturday, September 8, 2012

Meta-Trader - Super Mario Party

Welcome back, Meta-Traders.

It was a big week in world markets with a few notable developments as follows:

The European Central Bank (ECB) signaled their intention to create money out of nowhere and buy large numbers of EUR denominated bonds, taking a page from the US Federal Reserve and igniting a huge rally in EUR/USD.  As a result, US Stocks moved out to new 4+ year highs with the S&P 500 moving out to levels not seen since 2007.  Also, my favorite stock, Apple Computer quietly moved out to a new all-time high in anticipation of a release of the iPhone 5 expected this coming Wednesday September 12th.

Even more interesting is that this happened in the face of a very seasonally weak period for the stock market.  It reinforces the point that the "Smart Money" was widely expecting a correcting coming into September and as a result loaded up on put contracts and  long volatility which typically spikes in the face of big market sell-offs.  When everyone is expecting a sell-off, we don't get one, and instead the shorts and VIX bulls got slammed with volatility plunging throught the week.

While my Equity Portfolios benefited from this, my Forex accounts did not respond as well and the only account that was up for the week was Atinalla #3.  Breakout related systems took some trades in the breakout direction, but were shaken out on premature exits.  Fortunately, most accounts went out long EUR/USD with some solid unrealized gains as shown in the screen shot on the left.   We also took some gains in long AUD/USD trades in Atipaq Full Portfolio, but continue to be punished by our Atipaq USD/CHF instance.

Overall, Forex continues to underperform for me as an asset class.  But generally my assets continue to grow and I have my hands full with career and my son's college selection process.  My time will come with Forex, so stick with my on my journey and have a great week.

Sunday, September 2, 2012

Meta-Trader - Fun with Forex Historical

Welcome back Meta-Traders.

One cool thing to have come out of Asirikuy lately is forex historical data from http://www.forex-historical.com.  The site sells 5 minute Historical data on 21 currency pairs to Asirikuy members for a modest fee through an arrangement between Daniel and Forex Historical.  The site also offers free end-of-day data in for those same 21-pairs in 12-hour resolution. 

Free is always transformational, so I downloaded the data for the free end of day data to see if I could get a better idea about seasonality.  Specifically, I was contemplating how much seasonality can be measured.  Put another way, how much different are the movements of the market during 'busy' times versus quiet times during August?  With that in mind, I could potentially filter our trading signals during slow weeks to see if that would improve performance or perhaps decrease drawdown.

Data leads to information, and information leads to knowledge.  But you can't get there without some work.  So I dug right in and came up against these hurdles.  First, the data is in 12-hour format with a single 12-hour record for Sunday, then 2 records for Monday, etc.  I wanted to combine the data by date, so I imported it into MS-Access and ran some queries:

SELECT [EURUSD-Daily-RangePct].DayOfWeek, AVG([EURUSD-Daily-RangePct].PCTRANGE)*100 AS AVGOF1PCTMOVE
FROM [EURUSD-Daily-RangePct]
GROUP BY [EURUSD-Daily-RangePct].DayOfWeek;

That query produced the first graph which shows that Sunday evening session is the slowest, with only 0.6 times 1% of an average move.  Monday comes up to just under 0.9 of 1% move followed by higher values on Tuesday and Wednesday and Thursday topping out at 0.98 of 1% and back to 0.82 of 1% on Friday.  So much for the myth that Friday is the most active day of the week.

So with Days of the week tackled, I went onto seasonality.  The way the holidays fall you can't really be sure that active times are going to fall on a specific day of the month, so month's are much help.  I decided to go with this qualifier:

DatePart("ww",EURUSD1.Date) 

This picks off the "week number" of the year.  There are number of different ways to consider week numbers, but I don't care about the implementation, I just want to see what it tells us.  

SELECT DISTINCTROW [EURUSR-Daily-WeekNo].TheWeek, Avg([EURUSR-Daily-WeekNo].MOVE1PCT) AS [Avg Of MOVE1PCT]
FROM [EURUSR-Daily-WeekNo]
GROUP BY [EURUSR-Daily-WeekNo].TheWeek;

This query produced the following table.  There is one column for each week.  As expected the busiest time of the year is actually the 2nd week of the year with average moves of over 1%.  After that, the moves generally decrease then form another plateau around week 40.  The 2nd highest expected move week is week #45 which is late October, early November.   

So now that we are armed with this data, we can calculate our current week of the year and know how much movement to expect the coming week.  We just finished week #36 which ends a period of several weeks with expected moved under 0.9 times 1%.  In the next 3 weeks, we are now expecting generally higher moves of > 0.90 of 1% for the next 3 weeks.

Overall, the seasonality factor was not as great as I expected, at the maximum about 40% of the movement, but on average is was closer to explaining at most 20 or 25% of the price action.  Anyway, I will upload both the MS-Excel file (Forex-Historical.mdb) and the Excel Spreadsheet DayOfWeek-WeekOfYear.xls to by Yahoo Group in case you want to play around with it.

On the topic of Forex performance, we finally had a good week, with nice gains in almost all accounts.  But with the amount of draw down we have seen, its going to take some pretty spectacular gains just to get back to even.   

Its a healthy reminder that Forex is not an easy way to make money versus say equities which at least have a positive historical expectation.  Throw in a decent dividend yields and the expectation is even better.  Makes me wonder why I even bother with Forex.  Except that its a challenge and so much fun.

Have a great week and enjoy upcoming week #37 when we expect 0.92 of 1% average moves for the EUR/USD.

Saturday, August 25, 2012

Meta-Trader - 0.625

Welcome back, Meta-Traders.

Sometimes I get a bit goofy over numbers.  After all, they are just quantities and one quantity should get pretty much the same consideration as any other quantity, right?  Wrong!

On our way from counting from 1 to 10, we reach the number 6 which it turns out is pretty close to 0.618 times 10 - and 0.618 which is approximately the ratio between any 2 numbers in the Fibonacci sequence.   And I know from years of watching the markets that advances often pause, and sometimes retrace, at 0.6 times the a magnitude of an advance.  Like anything else it the markets, its not a hard and fast rule, just a limit to keep in your mind sort of like support and resistance.

When a stock goes from 20 to 1000, it will have to stop is the 600's.  And when a stock is going from 600 to 700, its going to have to stop somewhere at about 660.  And that's where we are with my favorite stock Apple Computer which this week reached the 660 mark, and then took a rest.  At that point, I decided to take some profits, since they came fast and easy.  At that point, the stock pulled back to about 650, then worked its way higher and closed the week at about 663.  Then after the close on Friday, the jury ruled in the Apple vs Samsung patent infringement case.  Apple won big and the stock close just short of 675 in after hours trading on Friday!

You know I have been on the Apple case for some time.  Not long ago on this blog I remarked that Apple was the second highest capitalization stock on the market just below Exxon Mobile.  Since then Apple is now the biggest cap stock ever in history at 581B, bigger than Exxon Mobile by almost half.   Its market cap is now more than double that of competitors Microsoft and IBM and almost 3 times that of tech titan Google.   Apple is a mega-trend in itself and its obvious what you should do, wait for a pullback and buy some deep in the money calls.  After a pullback to point of resistance (now in the 660 area), next stop is 700 on its way to 1000.  Don't over think it, Meta-Traders.

Forex showed some signs of improvement this week, with finally a winning trade in Atipaq USD/CHF after a long series of losers.  It seems, in some ways, the market has "learned" this system, and seems to find a way to hit its stop losses in the course of slopping around in the directionless Forex action we have seen lately.   Every system goes through losing periods but the question - whether I will be around long enough to withstand the draw down - remains to be answered.

Anyway, Daniel Fernandez will be coming back from Europe in a few weeks.  Perhaps his return will ride to the rescue of our Automated Forex career, and snatch victory from the jaws of Forex Failure.

I am more convinced then ever that adaptive trading algorithms - those which change their tactics based on what has worked recently - are the way to go.   The only system on Asirikuy which meets this description is Sunqu.  And all 4 accounts on Asirikuy are up - albeit modestly.   More to come on this topic.

Enjoy your weekend and what's left of the Summer of 2012.


Monday, August 20, 2012

Meta-Trader - AAPL Day Trade

Welcome back, Meta-Traders

I hope you took my advice from the weekend post to buy some Apple computer.  The chart on the left shows 5 minute bars with 3 moving averages: 8-period, 21-period and 50-period.   Check out the way we had a large opening candle followed by a partial re-tracement.  After that, it hugged the 8-period moving average all the way up the large red candle about 11:15 AM.  Perfect trading conditions for Oliver Velez type day trading.

After that sell off, AAPL went into a complex correction which eventually found support right at the 50-day moving average. Finally it closed at a new all-time high on the closing tick. A classic example of 'painting the tape'. 

Apple is now the largest capitalization stock of all time and has exceeded Microsoft and Exxon Mobile with this latest move.

I'm still long and expecting some further upside tomorrow before a blow-off top later in the week.

Sunday, August 19, 2012

Meta-Trader - AAPL New Highs

Welcome back Meta-Traders.

As you know I am a big fan of Trend Following. I like it because its pretty easy all things considered. You don't have to be particularly clever, or hard working, you just need the simple power of observation. And the stock that has made me more money than any other stock is - your guessed it - Apple Computer!!

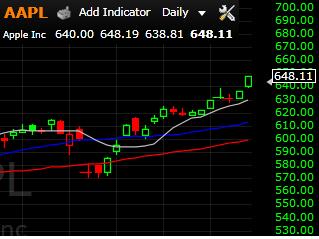
Apple staged a major breakout this week by eclipsing the prior all-time high at $644 set back on April 10th. This move corresponds with 4-year highs in the SP 500 and Dow Jones Industrial Average.  I didn't take as full advantage of this move as prior trades - using options - but I was (and still am) holding some AAPL shares in anticipation of more new highs.  

Last quarter's earnings in AAPL were a bit of a disappointment with earnings come in lighter than expected.  That accounted for the sell-off we see on the left hand side of the chart.  The word on those earnings is that sales of the iPhone were light because users are holding out for the introduction of the iPhone 5 - which is expected in the first few weeks of September.  There's also talk of another, smaller iPad and a new version of Apple TV!   If AAPL can do for the TV what they did for the cell phone, they could have a major hit on their hands.  Bottom line is APPL is coming into the fat part of their product cycle, and the fat time selling season (back to school and 4th Quarter) which are traditionally their strongest.   And with a 5-year earnings growth rate of 60% and a PE of 15, the stock is still absurdly cheap.  Next stop is $700 a share and beyond with an ultimate price target of at least $1000.   Don't bet the farm, but don't miss out either, this one is obvious.

And speaking of the obvious, Forex is going the other way with new equity lows in 3 of the 4 systems I am trading.  Let's review the damage.

Atinalla #1 is the only account still holding into gains and actually had a small gain for the week. While its down about -5.61 year to date, its still up about 23% since starting it back in November of 2010.

Atipaq Full Portfolio continued its losing ways, and is now down nearly 42% for the year and -12.46% since start up back in January of 2011.

Atinalla #3 is now down -22.84% for the year and -22.5% since start up back in January of 2011.

Finally, Atinalla Custom is down -26.49% for the year and a down as nasty -42.28% since start up back in November of 20.10%

No action in COATL H1 and Sunqu Live which are stopped.

Totaling the damage, I'm down just over $3000 on a $20,000 investment which is minus about -15%. 

Overall, its not as bad as the individual performance numbers would suggest. I'm going to continue to let the systems run since I recall at times in 10-year back tests, systems go into draw down that looks so nasty, I wouldn't have been able to stand it. If these systems are truly long-term profitable, then they should eventually assert themselves to the upside, right? We'll see, but in the meantime, I'm not committing any more money to Automated Forex Trading.

That's all for now. Go buy some AAPL, even its just 10 shares.  It will soothe the pain of money lost in Automated Forex Trading.   And have a great week.


Saturday, August 11, 2012

Meta-Trader - The Gapdicator

Welcome back Meta-Traders.

Taking a look at the way the markets have been behaving lately, we see a higher than normal instance of price gaps.  Gaps occur when today's low is higher than yesterday's high or when today's high is lower than yesterday's lows.  Since we are seeing more gaps, I thought it would be interesting to know just how many more than normal?

To find out, brought up TC2000 and added the gapper's indicator which is shown on the chart to the left when applied to symbol EFA which is the iShares MCSI EAFE Emerging Markets Index fund.  I picked this one since it seems to have a higher degree of price gaps  The primary gaps indicator appears above and spikes back and forth between 0 and a max of about 1.92 due to a squashing function.   I then overlaid a 20-period moving average and came up with the Gapdicator - or Gap Indicator.

For the EFA, the indicator is nearly 0.5 which is quite high.  For the S&P 500 EFT SPY, its closer to 0.3.  For most typical stocks with little price gapping, its much lower.  Here's a quick summary:

EFA - Emerging Market's ETF - 0.48 - Relatively high but historical high as high as 60
AAPL - Apple Computer - 0.25 - Moderately high but lower than historical high at .45
SPY - S&P 500 ETF - 0.3 - Elevated and sustaining highs
Most stocks - 10-15 - With occasional moves up to 20

What does this mean for our trading?

  • Day traders miss out on the full extent of the gain because they don't harvest the gap on the long side
  • Market is thin due to summer vacations etc.  Its also worth pointing out that volume on the stock exchanges is reaching record lows.  Other than the high frequency traders, most of the public is hiding out in Mutual Funds, ETF's or bonds.   As a result it seems to be either risk-on, or risk-off depending on the latest news from the Euro Zone.
  • Results are terrible for Forex for breakout systems which is getting whipsawed back and forth.  Its so bad, I haven't even looked at the results for the week, i'll update it later.
As a result, I have become sort of disengaged from the Stock and Forex markets lately.  Also, I'm coming to crunch time on several projects with my regular job which are keeping me hopping.  So I haven't had much time for extracurricular development lately.

But its worth pointing out that stocks seem to have lifted the lid on the recent range and broken out to the upside.  And the S&P daily chart is moving in a channel and to the upper right at about 37 degree angle.  

Whatever stocks are doing, its also worth pointing out that the 2% yield in the S&P 500 exceeds the 10-year treasury by 40 basis points.  In the end, dividends are what make stocks the place to be regardless of what the charts are doing.

Also keep in mind that the central banks can produce an almost unlimited amount of money - as long as inflation does not become a problem.  The European bankers don't seem quite as willing to create money as Bernanke and the Americans.  But when push comes to shove, they will do whatever it takes to keep the Euro, and the entire modern money economy from falling apart.  

That realization, plus a dose of potential optimism that Romney might win, are enough to keep a bid under stocks.  Have a great week.

Sunday, August 5, 2012

Meta-Trader - Forex Failure Analysis

Welcome back Meta-Traders.

Daniel  Fernandez once commented in one of his e-books that the psychology of Automated Forex Trading is one of the most difficult parts.  There's nothing difficult about making money of course, in fact what could be easier?  You just put up the robot and sit back and count the profits!

But what about when they lose money?   Its not like we arrived at these systems haphazardly.  After all, they are carefully selected from at least 10 years of back testing, with favorable risk/reward ratios, ATR based position sizing, robust coding techniques etc, etc.  And these systems were back-tested, forward tested with demo money then forward tested with real money which was earned and saved by your humble blog author.

When systems fail, the questions start to arise such as:

  • Are the systems working properly?
  • Has the underlying structure of the market changed rendering the systems no longer effective?
  • Are the forex brokers hunting my stop loss orders and since the market makers can see my stops, or put another way, is the forex market really fair?
  • Is is even possible to trade the forex markets profitably using Automated Forex trading? Sure we have 10-year back tests that are profitable, and data provide by the industry, but do we have any actual live results we can point to?
And that's when FUD (Fear, Uncertainty and Doubt) start to creep in.

Fortunately, we have plenty of data to examine the behavior of our systems.  We can compare the behavior of different instances of the same systems on different brokers.  We can also compare the behavior of systems versus their historical performance such as maximum draw down, consecutive losses and win/loss ratios.  Using those tools, let's see if we can come up with some answers to determine if we are just looking at a bad period of performance, or the entire Automated Forex Trading experiment is just low-hanging fruit for the market makers.

At the heart of my poor performance is the Atipaq USD/CHF instance which is embedded in 3 of my 4 live portfolios.  The box in the upper left shows the year-to-date performance of this instance in my Atipaq Full Portfolio account.  Atipaq USD/CHF is one of the best performing instances historically with a 16% average annual profit and a maximum drawdown of 22% on a 10-year basis.  On a year to date basis, this instance is down 17% which is not even that bad compared to its 10-year historical maximum of 22%.

To be fair, Atipaq USD/CHF had a good year in 2011, with returns of about 17% with drawdown less than 10%.  This lead the Atipaq Full Portfolio to an excellent year in 2011 and was up nearly 50% for the year.  And at one point, the portfolio was up nearly 96% from the start before it crashed and gave back all those profits and just went negative this past week when considered from the start.

Now let's try to tackle the above questions one by one:

1) Are the systems working properly?

Yes, this is clearly the case since I'm seeing consistent trading between my different instances as well as the similar systems on Asirikuy.  I'm not allowed to reveal specifics of the performance of systems on Asirikuy, but let's just say they are similar to what you see above.

2) Has the underlying structure of the market changed such rendering the systems no longer effective?

To examine this, we need to understand how Atipaq works.  Basically, it builds a box based on the range of price behavior over the Asian session, or some number of hours before the active period for the pair.  Then it basically buys or sells breakouts from the box with a TP being some multiple of the box size and the SL being the opposite side of the box.  So the real question is, how often does price movement, after breaking one side of the box, return to the opposite side of the box before hitting the TP?  It turns out the answer to this question is pretty much the win/loss ratio of the system.

The table on the left shows the win/loss ratio for Atipaq USD/CHF for the past 10 years.  Years 2002 through 2010 are based on back-testing and the figures for 2011 and 2012 are based on actual trading results.  

From the 10-year backtest, the win/loss ratio averages about 50/50, meaning it wins about as often as is loses on a historical basis.  For every dollar the system makes on winning trades, it loses about 60 cents on losing trades.  That means the system has to win only about 40% of the time to earn a profit. And we can see that for most years, the system wins  better than 40% of the time.  The only exception was 2007 where the wining % came in just under 40%

For 2012, Atipaq USD/CHF is on the losing side on nearly 7 out of 10 trades. And since the win % is clearly under 40%, the system is losing money overall.

Anyway, what this table shows is that the Win/Loss ratio for Atipaq USD/CHF is lower now, on a year to date basis, than its been any time in the past 10 years. 

3) Are the Forex Brokers hunting Stop Orders?

This one is pretty easy and is detected like this.

If the price has a single hourly candle averse move to briefly visit the price area, take out the stops then retrace back to the prior price area, the move is suspect.  Also, there would be no other trades before or after the suspect price movement for a number of bars. Unless there is a news event, there's no other explanation and its easy to see on a chart.  This particular spike may have been accompanied by a news event, since EUR/USD had a similar spike, but I can't be sure which one in retrospect.

Just how big is that hourly bar on the chart?  The range of the bar is 125 pips, versus the 14-bar ATR of the daily chart which is 140 pips.  Thus the range of that single bar represents 89% of the daily average true range of the pair!

When I started this blog post, I was suspicious that this type of price bar has caused me to lose money in GBP/USD trades lately.  Upon closer examination (using with the "browser" feature of MyFxbook), I found that I actually profited on these price spikes, once on 8/2 in GBP/USD and again on 7/27.  Also, I closed out a profitable long position in AUD/USD at the high price of that spike.

Can anything be done to put an end to stop hunting?  Well the systems can be modified to not submit stop orders and go with the broker default stop of 500 pips  The Meta-Trader systems could execute the order when the price reaches the given Stop Loss level.  This is higher risk, however since should our Meta-Trader platforms fail, we could be subject to an account-wiping adverse movement.  Also, we would still be subject to these stop-hunting price excursions since the market makers are going after much larger players then ourselves anyway.

In this end, while stop hunting is a negative for Forex as an asset class, its just as likely that we would profit from a price spike as lose money.

4) Is it even possible to trade the Forex markets on a long term basis profitably using automated systems?

In the past Daniel has pointed to data provided by the industry which indicates that Forex trading is long-term profitable by either manual or automated trading.  Its hard to trust data provided by the industry itself, and instead, I am inclined to trust data provided only by real, small investors such as myself.  I suppose the jury is still out on this question, and time will tell.

Not to be all doom and gloom, I'm having a pretty good year in equities, and Fridays +1% moving in the emerging markets ETF's EEM and EFA ended the week on a good note.

Enjoy the rest of your weekend and the coming week.