Friday, December 20, 2013

Active-Trader - The Fed - Again!

Welcome back, Active Traders.

It was a stellar week for the bulls.  The market shook off its recent weakness with a barn-burning breakout to new all-time highs after the Fed Announcement on Wednesday at 2 PM.  The long-awaited taper seemed to have something for everyone.  The hawks were relieved to see the end of extraordinary measures by the Fed.  The doves were relieved that the Fed thought the economy was good enough to take the foot off the gas pedal.  Also, the Fed signaled they would stop using the unemployment rate of 7% to signal an end of extraordinarily low interest rates.  That meant that rates would stay low for a good long time and stocks loved that.

All of this bullishness was good for my portfolio of course. The Ultimate Trading System did well and I had
nice continuation gains in most of my positions most notably Mastercard (MA).

As it turns out, I'm not following the system strictly.  For example, I took profits in CNBC just because I had a good gain in a short period of time and didn't want to give it back. Similarly, I continued to hold CELG despite triggering the range bands indicator to the downside and both of those appeared to be good moves in retrospect, at least for now.

I added new positions in Capitol One Financial (COF), Chipotle (CMG), Netflix (NFLX) and Nelnet (NNI).  Of those, the only one breaking out to a new high was COF.  The others were some recent favorites that I had traded out of recently and was able to reload at lower prices on the pop after the Fed Announcement.  All of this sent my Tradestation account out to new all-time highs, which is no surprise in this environment.

Overall, things continue to move in a positive direction.  The Santa Claus Rally has finally arrived and we'll join Santa for a glass of egg nog.  Enjoy your weekend.


Sunday, December 15, 2013

Active-Trader - Acceleration into Space

Welcome back Active Traders.

This past week was my first week executing the Ultimate Trading System in live market conditions.  One good thing about this system is that it should draw you into the strongest stocks right when they are ready to explode higher.

And speaking of exploding higher, social media stock TWTR eclipsed its post-IPO high of 50.09 on Tuesday and moved out into the low 50's.  My breakout antennae were twitching overtime and I didn't have to think about it very long before picking up some stock.  I held on until later in the week and dumped it on Friday just before it rocketed about 3 points higher.  I didn't exactly follow my system on this one, but it was a good trade anyway.

And speaking of good trades, I had another winner with Mastercard (MA)  when I picked up a few shares on Monday with the stock in new all-time high territory at 766.  Later in the week, it announced a 10 for 1 stock split and a big dividend boost.  That was enough to light a fire under the stock and it ripped higher and briefly tagged 800 before closing the week in the upper 780's.  After a 10 for 1 stock split this 780 stock will be $78 and becomes a perfect candidate for the 80 to 120 play which means the stock will soon be $100 per share then $120.  I've seen it enough times so I'm sticking with MA for now and may add some on a pullback.

Not all was positive this week. After a brief pop on Monday, the market pulled back every day this week.  I picked up some CELG on a breakout on Monday at about 172 and it quickly went into reverse.  I added more at 167 and i'm going to give this one some time and space to work out.  I got stopped out of ABC, JOY and IBKR. These setbacks offset some of my winners leaving my account flat to slightly down on the week.

Overall the market seems to be in retreat with signs the the economy is starting to improve and speculation rising that the Fed will reign in its easy money policy early next year.  We'll get some clues in the last Fed Meeting of the year which comes up this week.   Overall, I'm perfectly happy to stay under-invested in stocks until I see winning situations.  In the words of stock operator Dan Zanger - "Stocks are only good when they are going up."  Well said Dan-O.

Enjoy your week ahead.

Friday, December 6, 2013

Active-Trader - The Ultimate Trading System

 
Welcome back, Active Traders and Wealth Builders.

"Nothing succeeds like success." What can this recursive truism penned by Alex Dumas, 18th century French novelist tell us about trading and investing?  Enough to fill an adventure novel if you ask me.  And since trading an investing is always an adventure, let's get right to it.

This statement and concept gets to the heart of what I would call The Ultimate Trading System.  Like any good trading system, the Ultimate Trading System answers these questions:
  • What securities to trade
  • When to enter
  • Entry size or how much to trade and of course
  • When to exit
What to Trade

This system is about trading individual stocks.  I trade stocks because I find they fit my personality and risk tolerance.  Put another way, I understand how they work, the fundamentals that affect their movement, and I am awake for the key hours that they trade.  While all this might seem obvious,  if I ask the same questions for other instruments such as commodities, bonds and currencies, I cannot answer in the affirmative.  In other words, trade what you know.

As for which securities to trade,  this one is simple, trade stocks which are making new all-time highs.  It also helps if the stock has good fundamentals such as positive earnings, and a Price to Earnings (PE) ratio lesser than the 5 year earnings growth rate.  You can find a good discussion of the scan conditions for winning stocks in my prior post New High, Low PE, High Growth.   TC2000 is a key tool for this and there is not a market day that goes by that I don't run this scan to see what winners will pop out.

When to Trade

This one is simple, buy when the stock breaks out to a new all-time high after a period of consolidation.   This is another lesson in the obvious, but great winning stocks always break out to new-all time highs.  Note the key caveat about after a period of consolidation.  This means don't buy a stock after 8 straight new-all-time closing highs.  Its best to enter in the last hour before a daily close at a new all-time high.  At this point, it should be clear in retrospect what the daily chart will look like, and it should be clear that the stock is breakout out of a range of consolidation to the upside.

Entry Size

An easy rule of thumb I like to use is to limit any typical position to about 10% of my portfolio.  So for a 100K account, and a stock under $100, I start with 100 shares.  For stocks in which I have a high degree of confidence, I might go as high as 20%.  I always keep some spare cash in the account and I never trade on margin.  Of course I'm not going to win any investment contests with such a conservative approach, but it works for me because I am a conservative guy, particularly when it comes to my money.

When to Exit

Position Exit is always more difficult than entry, but to keep it simple, follow this rule.  Sell when the stock breaks the Range Bands to the downside on the daily chart.   For a discussion of my range bands indicator, see this posts Range Bands - Part 1.   In the post Range Bands - Part 3, I coded the Range Bands indicator in TradeStation and coded it as a Paint Bar study that you see on most of my charts.

For you market technicians, the range bands indicator says to sell when the stock breaks the midpoint on the 14-bar daily chart minus 1.06 times the 14-bar ATR (Average True Range).  Some other studies says to sell when the stock breaks the top minus 2 times the ATR to the downside.  These rules are pretty similar and they basically provide an exit point, but still give the stock plenty of time to gyrate.

Testing the System

To test the system, I fired up TradeStation and put together a simple strategy which looks like this:

The New High LE (Long Entry) is built into TradeStation.  The Parameter of 5 says buy on a new high for the year.  In reality, it doesn't matter so much since I will filter out entries for new all time highs myself using TC2000. Also, the system does not check for the "after a period of consolidation" criteria.  But since the system gets evaluated bar-by-bar from left to right, its going to buy the first breakout it sees.

The exit is handled by my RangeBandsLX (Long Exit) strategy discussed in my prior post Range Bands - Part 3.  The system sells on a break below the lower range band line with a 14-bar lookback.  Note that this is 2.12 times the average true range, so depending on the range of the stocks, it could be a significant loss from the entry.  If all goes well, and we picked our stocks properly, we should not see too many losses.

I ran the system (in retrospect for testing purposes) against every stock in the Dow Jones Industrials and it made money on 26 out of 30 stocks for 2013.  This is not much of a surprise since its been such a raging bull market in 2013.  But it goes to show if you throw winning stocks at this system, it will produce good returns.  Interestingly, I ran it against the DIA ETF itself and did not get positive results.

You might look at all this and say its not really trading, its more like investing.  I don't dispute that since it is somewhat of a buy and hold type system.
It also greatly favors bull markets and we are certainly in one of those.

I'm going to trade this system in my newly funded TradeStation Account with 100K in 2013 and beyond and keep you posted as to my long positions over on the right side pane of the blog.

Enjoy your weekend.

Sunday, November 24, 2013

Active-Trader - Ride of the Horseman

Welcome back, Active-Traders.

In my prior post 4 Horseman of Biotech I covered 4 top performers leading the back in the Biotech industry.   This past week, 3 of the 4 closed at new all-time highs on a raft of good news as follows:

Biogen IDEC (BIIB) gapped up huge on Friday on news that the European Medicines Agency approved their multiple sclerosis drug along with 10 years of regulatory exclusivity

Celgene (CELG) also gapped up but to a lesser extent when news from the same European regulator expressed a positive opinion on their treatment for pancreatic cancer paving the way for full approval later.

As for how I traded it, I went long some BIIB stock and call options when the stock broke out back on 10/28/2013.   Unfortunately, the stock only went south from that point and I had to close the options out at a loss.  I held onto the stock however, and added more plus added the weekly 240/245 PCS when it crossed 240 after bouncing off support after a pullback similar in magnitude as the prior pullback on the daily chart. That trade worked spectacularly well as shown the above chart and I'm still long the stock.  Its a classic case where the options fail but stocks succeed since they are much more forgiving.

As for other trading results, it was a rocky week, but turned out okay in the end.  Along these lines, I learned a few important things about the rhythm of trading weekly options and it goes like this:

  • Friday is a day for closing out positions which expire that day. Do not add new positions on Friday.
  • Monday is a NOT day for trading. Let the market declare itself.  Do not jump on any price moves, particularly in the early part of the day, as they will likely retrace or reverse later in the week
  • Tuesday - Thursday are the days to put on new positions which expire that Friday.  
  • Friday is a day for closing out positions put on Tuesday through Thursday.  Rinse and repeat.
What I have observed during weeks of options expiration is that there is always at least one day of heavy selling.  And since every week is now options expiration week, stocks that look great on the prior Friday and the following Monday almost always give you a better entry point later in the week. Once of John Carter's favorite strategies, is wait for the end of a day or 2 of heavy selling, then sell a spread 1 or 2 SD's away from the market.  At the time, it looks like a scary trade, and you are risking $4.50 to make 50 cents, but it almost always works out and becomes "free money" as JC would put it.

Things worked out for me on the long side the week because of good solid closing moves in the stocks I was trading, specifically, AAPL, MA and NFLX.   But at one point in the middle of the week, these put spreads were fully in the money against me.  Had I waited for better entry points, I could have had a much less stressful week and made just as much if not more money.

A few other developments:

- In an attempt to squash Small Account Syndrome, I have relocated some funds from E*Trade over to TradeStation where I will now have a full 100K account to trade.  I'm working on a trading methodology called The Ultimate Trading System which is a techno-fundamental combination of what I have been doing for years anyway but reduced to a set of fully-defined rules.

- I had a breakout week in my ThinkorSwim account and I have now earned over 9% year to date in that account which comes to just about 7.8% after commissions.  That exceeds what I have returned on the TradeStation accout over a 11 months of trading.  I have to be careful to not give back those profits and keep a clear head.

Overall my option trading has come a long way thus far in 2013 and I'm starting to learn the secrets of how to pull money out of the options market with some regularity.  The learning never stops in trading however, and perhaps that's one of the reasons why I enjoy it.

So wait for those entry points traders and for those of you celebrating, have a Happy Thanksgiving.

Sunday, November 17, 2013

Active-Trader - Breakfast in America

Welcome back, Active Traders and loyal blog readers.

Things are starting to look up in the good old US of A. Signs of a growing economy are starting to emerge reminiscent of Ronald Reagan's Morning in America political advertisement back in the 1984 campaign.  And much of successful trading and investing is born out of observing "general conditions" as noted by Edwin Lefevre in his classic "Reminiscences of a Stock Operator".

So here are my top 5 reasons why the economic conditions are improving.  You won't find this material anywhere else, so here goes.

5) Automobile Traffic on the rise

This one is purely anecdotal, but I have noticed that there are more cars on the road.  A Facebook friend commented the other day that it took her 2 hours and 20 minutes to drive from Manhattan to her home in suburban NY - a mere 17 miles.  Driving to work one morning, I noticed that there were a lot of cars on the road - and it was only 6:30 AM!  

The industry leading in traffic data collection in the US is Inrix.  I scoured the Inrix web site to see if I could find any hard data of increase in transit times, but came up empty.  I'm sure they have the data, but they are not giving it away for free.  Perhaps the underlying reason is number 4 ..

4) Gasoline Prices at 3 year lows

An excellent source of price data for gasoline is http://www.gasbuddy.com.  This site collects observations from local residents and tells you where to find the cheapest gasoline in your area.  Its crowd sourcing meets the Internet meets cost savings, what an excellent combination

Anyway this chart shows that gas prices are the lowest they have been in 12 months and a longer terms chart shows that they are lower than they have been since the middle of 2010.  This has a huge impact on consumer behavior since it allows for more free cash flow and generally puts downward price pressure on all consumer goods.

Add to this the fact that cars are becoming more efficient, people have less need to drive due to telecommuting and US Energy production is at an all-time high.  Also use of electric cars is on the rise and I saw one study that running your car on electricity is the cost equivalent of paying $1 a gallon for gasoline. These factors should keep downward pressure on energy prices, at least for the short term.  

Finally, note that gasoline moves in an annual cycle and typically bottoms in January or  February and peaks in the summer months so don't expect prices to stay low indefinitely.

3) Budget Deficit is Shrinking

Remember the sequester?  These were the automatic across-the-board spending cuts which started in early 2013 as a result of lawmakers inability to make a budget deal.  They have now become the new normal. This article in Bloomberg news explains it well Budget Deficit in US Narrows in October.  Also, a 12-day government shutdown in the first half of October slashed government expenditures while revenues are on the increase.

2) The Affordable Care Act

Healthcare has been a mess in this country for many years.  Ever year costs and deductibles go up, and benefits go down.  The ACA is an attempt to correct this mess and I could do an entire blog post on this topic alone.

In some ways the ACA will be a drag on the economy and individuals. It will hit the lower income proportionally harder since they will now have less money for discretionary spending.  Sales of lottery tickets and cell-phone data plans will likely suffer  But as a result, more people will have coverage, and they will use that coverage.  They will go to the doctor, get tests, get prescription drugs and take better care of themselves.  And this will lower the pressure on hospital emergency rooms which by law are required to treat people regardless of their ability to pay.

Health care is estimated to be about 16% of the entire economy and I expect it will grow to about 20% as a result of the ACA.  That means more jobs for people in the Healthcare industry.  Not only that, people will live longer, be healthier, and the uninsured will be less of a drag on society.   Lesson from the state of Massachusetts (where a similar plan was enacted in 2006) shows that the ACA will not reduce costs. In fact it will increase costs for all involved, but people will receive better care, live longer and be more productive as a result.

1) Stock prices are at new all-time highs.

You know I am a big stock investor so this one comes as no surprise. This past week we had new all-time highs in the SP-500 and the Dow 30 on 3 of the 5 days.  This has a tremendous 'wealth effect' where people feel wealthier, and therefore they spend more money since they feel more secure about their financial future.  And much of this we owe to an incredibly accommodating federal reserve.

Time and time-again, the Federal Reserve has come to the rescue of the american economy and exercised its ability to create billions of dollars out of thin air.  You would think this would lead to weakening and eventual collapse of the currency, but it hasn't happened - not yet anyway.

One last word - this economy is hardly the 1950's or even the 1980's.   Unemployment remains stubbornly high and many young people can't get good enough jobs to move out on their own.   Incomes are down and I continue to make less each year from my regular job and I still don't make as much now as I did during the tech bubble back in the late 1990's. But on the positive side, my personal wealth is at new all-time highs due to saving and investing.

Have a great week ahead all.

Saturday, November 9, 2013

Active-Trader - Small Account Syndrome

Welcome back, Active Traders.

You may have heard of Small Town Syndrome, or Small Dog Syndrome or even Small Penis Syndrome.  Well today I am a going to introduce a term into the financial lexicon called Small Account Syndrome.

I would define Small Account Syndrome as an acute difficulty in growing a small account, even when you don't have similar problems growing large accounts.   And I am a walking, talking example of Small Account Syndrome because I'm having a decent (although not stellar) year in my large accounts returning in the 11-12% range.  Meanwhile, my small TradeStation account seems to struggle along and is up just a measly 2% for the year.

Now granted I'm not that great of a trader.  But I'm also not full-time and I try to trade along side my other responsibilities including a house, family and a full-time job.  If I were a full-time trader, I would expect a much higher rate of return commensurate with a full-time effort.   But that said, I've noticed some key psychology affects around small account that constrain their growth.

Before we get into that, let's me say that I have blown up a few accounts in my day.  I blew up a Forex account with FXCM prior to 2010, another Forex Account managed by Zulutrade documented here.  Also, I blew up several smaller Forex accounts documented right here on this blog.  Also, I blew up an Options Express Account a few years back.  All blow-ups did not results in a complete loss of funds, but loss of enough funds to realize it just wasn't working and that it was time to throw in the towel and close the account before doing any further damage.

So suffice it to say I have experience blowing up accounts to be an authority on the subject - and they are always small accounts. Since they are small means that I have never been wiped out so much to be knocked out of the game.  After all, survival is the key to successful investing - in other words stick around long enough to learn from your mistakes and you will eventually get it right!

Here are the key factors working against small accounts:

Need to be Right

As John Carter as pointed out, we are trained from a young age to strive for perfection.  In other words, be on time, pay attention in class, get good grades in school, get a good job etc.  I can relate to all of the above since I try my best in nearly everything - all the way down to separating my recycled items from regular trash and rinsing out the container.

And nowhere is the pressure greater to get it right than with a small account - particularly with that first trade. Its your inner teacher looking down on you and waving their finger and saying "don't screw it up!"

Watch the Basket

There are 2 philosophies of trading:

1) Don't put all your eggs in one basket and
2) Put all your eggs in one basket - and watch the basket.

With a small account, you can't put on too many trades.  This is even more of an issue with option spreads where your max profit exceeds your max loss.  For my typical spread which is $5 wide, I am making $170 and risking $330.   If I put on 5 of those, and 3 of 5 go bad, you are now down $650 on a 10K account or 6.5% which is not so easy to recover from.  Thus there is even more pressure to get it right.

And it all came to a head this past week in my Think or Swim account, newly funded with 10K and ready to trade. So here's what happened:

TSLA - 150/155 - 195/200 Iron Condor

This trade was put on Tuesday 11/5 just before the close.  Tesla stock was at 175 and the expected move was about $20. So I sold the 195/200 Call Credit Spread for a credit of $1 and the 150/155 Put Credit Spread for a credit of 0.85.  So I took in a credit of $185 for a max possible loss of $315.

I watched nervously after hours as the stock traded and it immediately came down just above my short strike at about 158 and bounced around until the end of the after hours session and came to a rest at about $155. The next morning it opened closer to $159 and I breathed a sigh of relief.   But that was short lived and the stock soon dropped through my short strike - and in no time at all was fully in the money against me at $150.

Later that day, its a relief rally and got up to as high as $154.45 and my hopes were renewed.  But that didn't last either and the stock rolled back over and headed south.  The next day it gapped down and trade as low as 140, then had a brief rally.  I knew this trade was toast and that the TSLA balloon had popped.  So I closed the 150/155 PCS for a debit of $470.

So here I was, on my very first trade in my new Think or Swim account, I lost $285 or about 2.8% of the account on my first trade!   This was not good news since my experience with accounts (and investments generally) is the best ones are winners right from the start and the ones that lose go into the hole soon after entry.

Well I had to redeem myself and was not going to let this account be a failure, particularly after all my years of trading and investing.   Here's what happened next.

PCLN 190/195 Call Credit Spread

This trade was put on prior to earnings on Thursday afternoon.  The stock had a large sell-off that day, trading from $1045 all the way down to about $1022 at the close.  The expected move was an incredible $60 so I added that to 1030 and came up with the 1090 strike.

I knew I had to go big or go home on this trade, I put in an order to sell 4 of the 190/195 Call Credit spreads at 1.10.  If the trade worked, it would net me $440 and more than make up for the loss on TSLA. I put in the order and waited and just prior to the close, I got filled on 3 of my 4 contracts and cancelled the remaining contracts.

This trade clearly exceeded by risk parameters - risking $4 to make $1.10 and doing it 3 times over.  I watched nervously for the action to unfold just after 4PM EST.

The after hours action in PCLN was insane, trading initially down to about $1000 then as low as $945 then as the news came out higher and up to as high as about $1070.   It closed the after hours session in the middle of the range at about $1039.

Friday brought more anxiety as the stock moved around trading as low as $1019, then started moving steadily higher.  In no time at all it was $1060 then trade as high as $1075 and I started to get nervous.  I watched prices for the spread fluctuate between 0.20, and 0.60 and I sat on my hands and resisted the urge to take a profit.  I learned from trading spreads that you have to stay cool and give them every chance to expire at max profit.  I watched PCLN very closely for most of the day Friday and finally started to relax around noon time.   The highest the stock could get was about $1077 and I let it expire worthless for max profit.

Bottom line after all that is, I made up my entire loss in TSLA and put the account up $45.  And I rescued the account from a losing week and put it into the positive which was an important psychological victory.  Also, I learned that its okay to have an opinion on earnings trade - you can put on just one side and you don't always have to put on a Condor.

I also had a few decent trades in my TradeStation account like the stock and options play in CMG shown above.

So for this week anyway, I snatched a small victory from the jaws of defeat.

Have a great weekend and get some rest.

Saturday, November 2, 2013

Active-Trader - The After Hours

Welcome Back Active Traders and Wealth Builders.

It was a wild and very active week and overall not a positive one with all of my accounts giving back some ground from recent highs.  My TradeStation account took a particular bruising.  So much happened that I need to go back on a trade-by-trade basis and see what worked and what did not. Much of the action was centered around earnings, so let's get to it.

Last Friday, I went out long a small amount of Biogen Idec stock (BIIB) on a Friday close into new all-time high territory in the low 250's.  I didn't realize that earnings were due Monday, so that was my first mistake. In any case, the stock opened up nicely on a good earnings report and I was up about 10 points early on and the stock trade as high as 262 early Monday.

BIIB Nov 16 245 Call

Later in the morning the stock pulled back and John Carter from the Simpler Options room put on a bullish trade, and I followed, buying the November Monthly 245 call at 14.70.  After being up briefly, the stock followed the general market lower.  The shares never recovered their highs and instead drifted steadily lower.  The pain continued and I ended up closing this contract for 6.30 later in the week.  This trade really hurt my account and I lost $840 on this trade.

I held onto the stock the whole time however, and I expect it to recover and eventually move out to new all-time highs.  In retrospect, it was not smart to buy this contract after earnings.  I expected continuation and did not get it.

AAPL Nov 1 495/500 - 560/565 Iron Condor

This was an earnings trade put on just prior to the close on Monday when earnings came out after hours for a credit of $195.  This stock acted perfectly and I closed out the put side (sold for a credit of $1.05) for a debit of $20 and the call side went out worthless which means I collected the entire $90 received.

FB Nov 1 49.5/50 Put Credit Spread

I put this trade on Tuesday ahead of earnings on Wednesday for a credit of 0.25.  Since its a 50 cents spread it was exactly a 1/1 Risk/Reward ratio. All the stock had to do was close above $50 for me to receive the entire credit.  After a wild ride later in the week, I ended up closing the spread for 0.20 taking a small profit.   See below for more on Facebook which was a wild ride for sure.

BIDU Nov 1 140/145 - 175/180 - Iron Condor

This was another earnings play put on Tuesday just before the close with earnings due after hours.  With the stock at $160 and an expected move of $13, I sold a put credit spread below for a credit of 1.10 and a call credit spread above for a credit of 0.85,  for a combined credit of $195.   The stock acted almost perfectly and I closed on the whole thing for a debit of $20 on Thursday so this trade worked out well.

LNKD Nov 1 220/225 - 275/280 - Iron Condor

This was another earnings play put on Tuesday just before the close with earnings due after.  With the stock at $242 and and expected move of $21,  I sold the above condor for a credit of $195.  The stock acted almost perfect until later in the week.  The 275/280 went out at max profit, but I close the 220/225 at a debit of 3.85.  So I took a loss of $190 on this trade.

FB Nov 1 43/45 - 55/57 - Iron Condor

This was an earnings play put on Wednesday afternoon with earnings due after hours.  With an expected move of $5 and the stock at about $50, I sold this spread for a total credit of 0.80.  Since it was a $2 wide spread, an 80 cent credit was well over 1/3 of the width of the spreads, so this trade met my criteria.  Since this was a low credit, I did 2 contracts.  After much gyration of FB stock, this trade went out max profit and I collected the entire $160.

And speaking of Facebook stock, it was a wild ride in after hours.  The results were good and the stock shot as high as $57.44 in the after hours.  I was feeling good since I was long 500 shares in my E*Trade account.  But after that, the stock went into a downward spiral and gave back the entire after hours move and actually traded as low as $47.25 later that day.

I don't ever recall seeing such a complete reversal of fortunes in after-hours trading.  FB traded much like an ill-liquid futures contract going all the way up and all the way back down.  I ended up closing my long stock on Friday at about $51.6 taking a 1.5 point profit on my $500 shares.

Finally, I re-loaded those same 500 shares and went out long once again on Friday at about $49.75.  I will unload them next week anywhere above $51.50 if I get the chance.  This is a traders market, and you have to take profits when you have them.

FSLR Nov 1 - 44/46 - 55/57 Iron Condor

This trade was put on prior to earnings on Thursday with the stock at about $50 and an expected move of  .60.  I got a credit of 0.38 on the put side but could not get a fill on the call side at about 0.35, which was clearly right smack in the middle of the bid/offer.  I finally got frustrated a put it in at the market and they filled me at 0.13 cents.  I did 2 contract, so I received a total credit of $100 for a max possible loss of $300.

Of course the stock shot higher and well above the upside strike.  I ended up taking close to a max loss on this trade closing out the 55/57 spread for a debit of 1.80 for a total loss of $260 on this trade.

SNDK Nov 1 68/70 Put Credit Spread

This $2 Put Credit spread was put on earlier in the week for a credit of 0.70 which was well within my plan. The stock spent much of the week above $70 but ended up sagging at the end of the week.  I closed it for 1.40 for a loss of $70.

BA Nov 1 129/130 Put Credit Spread

I put this trade on last Friday along with a small long position in BA stock.  The spread was for a credit of 0.30 (times 2 contracts).  The stock closed well above $130 so I collected the entire $60 profit on this trade.  I did the same trade on Friday and entered the 131/133 Put Credit spread for a credit of 0.75 which is well within my plan.

All told, I lost about $785 on the week in my TradeStation account.  Had I avoided the nasty loss in the directional trade in BIIB, I would have done pretty well with the earnings plays.  I clearly have some work to do before I learn out to safely and regularly pull money out of the options market, but I am learning.

Have a great weekend and get some rest.

Saturday, October 26, 2013

Active-Trader - GOOG 13110C1000

Welcome back, Active Traders.

I have kind of a love-hate relationship with Google.  As for the Love part, you have to love a company created from nothing less than 15 years ago by a pair of college Computer Science majors.  Now the company has the 3rd largest capitalization of any company on the US market.  The other part of the love is that Google hosts the blogger platform that makes this blog possible - and I have never paid them a nickel to use it.

As for the Hate part, you have to resent a company this powerful. Note that Google keeps a record of everything you have ever searched for by source IP address.  Think about everything you have ever searched for through Google and think about how much Google knows about you as a result.  For that reason alone, I have started to use bing.com for all my web searches. Bing is hosted by Microsoft - But Its Not Google.

The other part of the Hate relationship is that I went for a job interview with Google in New York City. After weeks of preparation, they basically laughed me out the front door.  That's right - I am not nearly smart enough to work at Google.  Well maybe it wasn't quite that bad, but it felt that way.

Another thing about Google is that it has been notoriously hard to trade.  Recall in last week's post, I went into the weekend long the 995 call at about 21.  At the time, the stock was about 1011, and I was expecting a gap up to the 1020 area on the open.  That would yield a quick $900 profit which I was eager to collect in my TradeStation account which has been struggling to get out to a new equity high.

Early in the pre-market on Monday, the stock was trading at about 1020 and I already licking my chops at the easy profit I would collect.  There's nothing like a $900 profit to get your day off to a good start.  I was watching right at about 9:30 and was disappointed to see the stock open in the 1012-1013 area.  I had about a $100 profit on the contract and I know from opening gap plays how fast the stock can reverse after the gap.  So I put a stop loss in at least to lock in the $100 profit and waited for a fill.  The stock dropped though my stop but no fill.  I sat there for a minute or so and waited, reminiscent of my prior post The Gap, Freeze and Slip.  About a minute later, my fill came through - filled for a loss of $45!

How could what should have been a $900 profit turn into a $45 loss?  The options market has many way of separating you from your money and I could only conclude that events have conspired against me.  But I got my just deserts later in the week and here's where the story gets fun.

I was watching Google on Wednesday and the stock was strong.  It had traded down to the 1000 area and bounced strong and was headed for an all-time closing high.  I was about 1:25 PM EST and the stock cleared the 1017 area.  So I picked up the next Friday GOOG 1000 call for about $24 giving the stock a fair value of $1024.  After a brief rest, the stock moved higher.  I was surprised to see it clear 1020 a short time later and I was up a few hundred.  This time I sat back and gave it some room to breath and sat through a brief pullback in the mid $1020's.

I continued to ignore the stock and was surprised to see it break the 1030 zone not too much later.  Now here is was less than 2 hours after entry, and I as up nearly $1000!   So I put in a limit order to sell at $34 and was filled instantly.   I had my revenge, I bagged $1000 on Google options in less than 2 hours time!  Total commission paid on the trade $2.  TradeStaion worked like a champ on this trade - total commissions paid on this trade $2!

So that trade aside, I have been struggling in my TradeStation account.  I haven't seemed to find my edge. On the plus side, the account has been positive from the beginning and hasn't gone into an equity draw down from its opening value - not even once.  At one point I was up 10% - peanuts by John Carter standards - but not bad for me.

I came to the conclusion last week that I need to pick my trade entries much more carefully and wait for well-defined setups on the daily chart before taking action.  More to come on that.

Enjoy your weekend and have a great week ahead.

Saturday, October 19, 2013

Active Trader - More Equity Highs

Welcome back Active Traders.

It was another spectacular week in world equity markets with the SP-500 and Russell 2000 indices making new all-time highs.  Meanwhile the Nasdaq 100 made it out to a 13-year high and has now retraced about 75% of its huge 80% decline between the high in March of 2000 to the low of December 2002 in the bursting of the tech bubble. 

All this bullishness sent my net worth out to new all-time highs for the 4th separate time this year.  My favorite social media stock Facebook, had a spectacular week tacking on 10.4% to a new all-time high.  As we can see from the chart on the left, the stock has not yet made it to the 161.8% extension of the recent high to low swing.  I expect much higher prices ahead and earnings are not due until 10/30/2013 after the close.

And speaking of spectacular, Google announced blowout earnings on Thursday afternoon, and the stock went parabolic, closing the regular session at 888 then sharply higher in the after hours session.  By the end of the day Friday, Google closed at 1011.41, up a spectacular 123 points or 13.5% for the day!

This caused a feeding frenzy for all things tech and ignited a huge broad market rally on Friday.  I did not participate in Google, but went out long the GOOG next Friday 995 call expecting a gap up on Monday.  Many investors would never consider taking a long position after such a big up move,. But experience has shown that moves like this typically lead to continuation and I expect to flip out the call for a nice gain into a gap up on Monday.  The stock traded as high as 1015 in the after hours on Friday so that trade is looking good so far.

Part of this week's rally was due to a deal in Washington that ended a 13-day government shutdown and extended the debt limit until mid-February.  The country also came dangerously close to a default on its debt which led to much concern around the globe including a pair of editorials in China newspapers scolding the US for being so irresponsible with the threat of default of debt payments.  The newspapers also called for a de-Americanized world economy less reliant on the US dollar as the world's default currency.

Students of American history will recall that politics in the US has always been a bitter partisan struggle. From the battle between States Rights versus Federalists to North versus South, Republican versus Democrat,  Red States versus Blue States, American politics have always danced on what seems like a razor edge between opposite interests.  It all came to a head in the election of 2000 when the race between George W Bush and Al Gore was so close it came down to the decision of one state - the state of Florida.   The declared loser Al Gore challenged the outcome in the Florida Supreme court.  After an agonizing 6 weeks of uncertainty, the impasse was ended when the US Supreme Court trumped the authority of the State of Florida Supreme Court and declared George Bush the winner.

The point is the US system is designed to resolve these issues in favor of the majority - no matter now narrow it is.  The winner-take-all nature of the presidential electoral system is designed to enforce unity by making the outcome of elections seem much more decisive than would occur if it came down to a populate vote.  And the 3-way power split between the House, Senate and the Executive branch almost forces 2 of the 3 powers to come down on one side or the other.  In this case, the Senate and the President (controlled the Democrats) came down on one side and the House of Representatives (controlled by the Republicans) came down on the other side.  Anyone with an elementary school education in US Politics could see that there was no way the Republicans could win.  They finally gave in with less than 12 hours to go before default.

Despite all the drama, the stock market just seemed to shrug it off and even rallied in anticipation of a deal before it was even announced.  So for all you out there that think America politics is a mess, you are right.  But get used to it, because this is how it works.

Meanwhile, I continue to be impressed by the ThinkorSwim platform.  The Calendar feature on the Marketwatch tab gives a quick graphical overview of key events by day of the week and time of day.  Events are color coded by Dividends (Green), Earnings (Blue), Conference Calls (Red), Stock Splits, (Purple), and Economic Events (Violet).  Click on an item to get details of the event.  Check and uncheck the boxes on the left side to show or hide various combinations to meet your needs.

The Heat Map feature on the Marketwatch tab gives a box-based graphical representation of what is moving in the market.  The universe of represented stocks can be modified between index compoents such as all members of the Dow-30 or your own personal portfolio or watch lists.  Boxes are grouped by sector (such as energy or Information Technology).  The size and color of the box indicates the magntitute of movement up or down.  Looking at this graphic, which 2 stocks moved the most on Friday?

Finally, the Chart tab has a number of cool features that side in from the right or from below.  This view shows the Level 2 screen which shows the depth of bids on the left and offers on the right.  This gives you an easy visual representation of whether there is more demand (bids) or supply (offers) for the stock.  Check out this screen shot of the Level 2 screen for Facebook and tell me whether there are more bids (left) or offers (right).

Funding for my Thinkorswim account is in progress and I proceed once I start to get the proceeds of my Forex Accounts.

That's all for now, have a great week ahead.

Sunday, October 13, 2013

Active-Trader - The 1.272 and the 1.618

Welcome Back,  Active Traders and Wealth Builders.

This past week we finally got the nasty correction in the stock market that I predicted back on my poetic post Evidence of Autumn back on August 11, 2013.

This is not much of a stretch of course, given all the evidence.  Its amazing since one would think the odds of a market sell-off would be distributed evenly throughout the days and months of the year.  But its not the case since, for whatever reason, the stock market always finds a reason to sell off hard in the month of October.

One thing I have learned from the my time in the Simpler Options trading room is the importance of Fibonacci time and price relationships.  The chart in the upper left shows a chart of Facebook made with TOS using the Fibonacci Price Retracement tool.   The chart shows the high at $51.60 and the subsequent low formed 8 days later at about $45.40.   A few points to consider:
  • The entire move from top to bottom constitutes 100% of the original pullback
  • The green lines represent 50% and 61.8% of the original move which is a normal retracement of a move in the primary direction.  I bought FB near the high of the low bar and expected a move back to 61.8% of the move to take profits.  I took profits too early, but that's the subject of a different blog post.
  • The Cyan (light blue) lines represent 78.6 and  100% of the original move
  • The purple lines represent 127.5% and 161.8% of the pullback and represent targets or points of future resistance should the price break the old high to the upside.
Like support and resistance, Fibonacci levels represent likely levels of resistance after a move occurs. They are not hard and fast levels, rather price points to be aware of after well defined moves from top to bottom.

So put on your Fib glasses people and be aware of these price relationships on daily and larger levels since they let you know when to take profits.

That's all, have a great week ahead.

Sunday, October 6, 2013

Active-Trader - Welcome Thinkorswim

Welcome back Active Traders and Wealth Builders.

Between E-Trade and TradeStation and TeleChart 2000, the last thing I need is another broker and charting/trading platform.

But based on input from my friends over at Simpler Options, I'm starting to see the benefits of Thinkorswim  abbreviated TOS.  TOS traces its roots to Telescan founded in Texas back in 1983.  In 2009 Thinkorswim was acquired by brokerage giant TD Ameritrade which is itself a subsidiary of Toronto Dominion, the Canadian Bank.  The TOS faithful were pleased to find out that TD would hold onto the TOS team and platform and brokerage, run it alongside their less advanced web-based platform.

There is so much to this platform, its going to take some time to get fully immersed.  The screen on the right
appears as a pop-up over the main screen and itself contains a wealth of information.  On the left a live stream of CNBC during market hours.  On the right a series of clocks showing time in Chicago, London and Toyko.  Underneath are a series of upcoming economic or earnings developments with the time of day expected.

The central portion of the screen shows news of interest, and in this case release notes on the latest release of the platform - just released yesterday as a matter of fact.

Pit Noise

On the left side (not shown since the market is closed) are a series of chat rooms and audio/video streams. The most popular room by number of attendees contains a live broadcast from the S&P 500 Pit at the Chicago Mercantile Exchange. Click on this link and you will see a live TOS screen showing S&P, Nasdaq and Russell Futures.  But the really cool part is the audio commentary.   What you hear is something that alternates between a carnival barker and auctioneer, with occasional breaks back to normal speaking to point out Daily Pivots, Highs or Lows for the day and commentary on the pit action.

One very interesting thing is that the commentator has 2 distinct audio modes.  One is a low monotone and somewhat hypnotic which delivers the current bid and offer.  Then he breaks the monotone to point out new highs or lows or interesting action in other futures markets includes Gold, US Dollar and Oil.  And then he goes right back to into the hypnotic monotone on calling the price action.


I have often read that pit traders have a hard time making the transition from Pit Trading to Screen Trading and now I understand why.  The Pit commentary gives you an entire wealth of information, at a very sensory level that you can't get from a TV or a chart.  Some examples:

The level of activity and excitement based on the level of animation of the speaker
- Comments on activity of the major players and whether they are "at the bid" (buying) or at the offer (selling).
- The players fall into one of 2 major categories:

Paper - These are the traders who represent the major institutional players
Local - These are the local traders who make a living making a market in the pits

By listening to this flow, you can easily whether anything of interesting is going on, and on which side of the market are the major players leaning.

Based on the type of trading I do, this information doesn't make a whole lot of difference, but I think its very interesting to get the underlying tone of the markets from the place where the big players make a market.

On the financial side, the commissions are not as good as TradeStation.  Based on the association with Simpler Options, I can get a $1.50 per option rate versus $1 per option from TradeStation.  But I also get an array of Futures Markets that I don't get from TradeStation without buying a data package.   The futures data alone makes the platform very handy for checking market action after hours.

One example in Sunday evening at about 8 PM EST when the 24-hour Live futures markets trade.  I recall during some fateful times during the financial crisie of 2008/2009 when John Carter came in and traded the futures Markets to take advantage of huge moves when most traders were still drinking beer and enjoying Sunday Night Football.

So we add TOS to our large arsenal of trading tools.   Have a great week all.

Saturday, September 28, 2013

Meta-Trader - Forex Shutdown

Welcome back, Meta-Traders.

The time has come to shut down the bulk of my Automated Forex Trading operations.  As you know this blog was created to chronicle my experience with Automated Forex trading through the Meta-Trader platform.  After nearly 4 years, 263 blog posts, and countless hours spent coding, testing and analyzing Automated Forex Trading systems, its finally time to throw in the towel.

I suppose this post is a long time coming, but I wasn't quite ready to admit defeat.  After all, I have wiped out in Forex before, once with FXCM in 2007, then with Zulutrade in 2009 as chronicled on my prior blog ZuluTrade News and Views.  So this effort would be my third failed attempt to trade Forex and (as the saying goes) 3 strikes and you are out!

Early on in my journey, I met Daniel Fernandez from Asirikuy.com through is blog Mechanical Forex. Immediately I was intrigued by the science, the hard work and the degree of rigor Daniel put into his work. And it seemed entirely logical and responsible to believe that a trading strategy that worked with a good degree of consistency for the past 10 years would continue to work into the future.  After all, the proof was in the back-tester report, how can you argue with 10+ years of back test history?

So I went forward with a full degree of energy and enthusiasm and even created a 5-year plan for my Automated Trading career as found in my post Forex Trading - My 5 year plan.

So how did it go?

After a year a planning and preparation in 2010, I really went full guns in January of 2011.  Immediately things went well and I came out of the gate strong in January 2011.  In my Atinalla No1 account,  I gained a stunning 18% for the month of January and ended 2011 with a solid gain of about 16.78% for the year as reported in my post Meta-Trader - 2011 Wrap-up.

2012 was a rough year with my results chronicled in my post Forex Trading - 2012 Wrap-up.  As per my plan, I doubled my investment from 10K to 20K at the start of 2012, and ended up losing 26% for the year. This was a setback and I ended up closing 2 of my 6 accounts with about -$2000 of realized losses.  I went forward into 2013 with the 4 accounts and about 11K under management you see in the graph above.

2013 has been another rough year so far and I am down another 20% taking my total assets under management to just under $9000.  Most depressing is that my Atinalla No 1 account, one which still had a solid profit from the start ended up giving back its profits and grinding down to just about break even from the start as shown in the above graph.

Strictly financially speaking, it wasn't that much of a disaster since I kept my accounts to a small percentage of my total assets.  All told, I lost about -$5600 or about 25% of the total of 20K which I had invested at one time.  That includes the money I made in 2011 minus losses in 2012 and year-to-date losses in 2013.

To be completely fair to Daniel, he never promised riches in the area of Automated Trading.  The supposition of profit was something that I brought to the table.  He instead promised an education and understanding in the area of Automated Trading.

But Daniel himself seems to changed his opinion of Automated Trading in his recent post Long term profitable back-testing: No guarantee of future profitability. This post seems antithetical to the very point of Asirikuy.  Automated Forex Trading may be fun, but if it doesn't make any money, we can think of better things to do with our free time.

As for the fundamental reasons the systems failed, evidence seems to show period of bad performance for automated trading as shown by the Barclays Systematic Traders Index.  Perhaps is because of the distortions created by the extraordinary period of monetary easing being done by the US Central Bank as well as other Central banks around the globe.

As for Asirikuy I have canceled by membership.  I don't have any I'll feeling toward Daniel and on the contrary, I hold in him high regard and consider him to be a friend.  But as for trading, he doesn't seem to have found profitability and all traders struggle on the path to profitability.  Its as much a matter of finding out what doesn't work as what does. And (for me anyway) Automated Forex Trading hasn't only lost me money.

My plan going forward is to shut down the Atipaq Full Portfolio and Atinalla No 3 accounts and fund a new account with the Think or Swim platform.  More to come on that and enjoy your weekend.

Sunday, September 22, 2013

Active-Trader - In Fed We Trust - Part 2

Welcome back Active Traders and Wealth Builders.

Back in my prior post In Fed We Trust , the US Federal Reserve had just announced its plan to create billions in reserves (out of thin air of course) to buy financial assets in an attempt to stimulate the economy.  That was back in November of 2010.  Now fast forward to nearly 3 years later and the Fed has added many billions to their balance sheet and US Stocks have added 40% to their value since then!

Expectations were high this past Wednesday that the Fed would "taper" or finally ease back on its ultra-aggressive monetary stimulus plan.  Bernanke himself signaled such a move earlier this year and the market widely expect a taper of between 10 and 15 billion per month dropping its purchase of financial assets to a mere 65-70 Billion per month.

So all eyes were on CNBC this past Wednesday Sept 18, 2013 at 2PM.  We all expected a generational low in easy money policy and a signal that the economy had improved enough to stand on its own and without further extraordinary monetary stimulus.   And what did we get?  No Taper, or continued easy money policy!

The markets loved it of course and immediately took off like a shot sending stocks and my net worth up to new all time highs once again for the 3rd separate time this year.

As for individual stocks,  I added shares to my existing position of call contracts in social media company Facebook (FB) which is now my largest single position.  I also started a new position in social media company Yelp (YELP) and I'm also looking to start a new position in real-estate media company Zillow (Z).  Aside from that, I am trying to keep my power dry since we still are in a period of negative seasonality.

As for my TradeStation account, I continue to struggle.  I'm still up for the month, but lost some equity this past week and still have not eclipsed my equity high achieved 3 weeks back.  In last week's post My Trading Plan I laid out my ground rules for entering and exiting positions.  So let's briefly go through my trades for the week and see if I followed my plan.

CMG- 9/21/2013 - 905/910 Put Credit Spread

Put on this trade for a credit of 1.90 back on 9/9 and closed it out for a debit of 0.40.  So took a profit of $150 on this trade but left $40 on the table and did not follow my trading plan.

BIDU - 9/21/2013 - 41/43 Put Credit Spread

Put this trade on for a credit of 0.70 on 9/17 and it expired worthless so I collected the entire $70 with no closing transaction.  Plan was followed, good job Chris.

MW - 9/21/2013 - 35/36 Put Credit Spread

This was part of an Iron Condor I put on for an earnings play back on 9/11 for a credit of 0.25.  I closed it out for a debit of 0.99 and therefore lost about 0.74 times 2 or about $140 on this trade.  This only positive is that I took nearly a complete profit on the opposite leg (40/41 CCS) which I sold for 0.30 and bought back for a debit of 0.04, total profit of $56.  I followed my plan on the PCS since it was clearly in the money, but did not follow my plan on the CCS which I should have let expire worthless since it was way out of the money.

TSLA - 9/21/2013 - 165/170 Call Credit Spread

I put on this trade on last Friday 9/13 for a credit of 1.80.  This was a bearish position and all the stock had to do was close the week below 165 for me to take the entire credit.  Unfortunately, the stock shot out above the short strike at 170 on an analyst upgrade.  I closed it out for a debit of 4.58 (somewhat short of the max loss of $500) on Thursday

I followed my plan on the exit, cutting my loss once it was obviously a loser.  But I did not follow the plan on the entry and I look the trade because the chart was in a bearish distribution pattern.  However there was not a clear setup on the daily chart.

NFLX - 9/21/2013 - 300/305 Put Credit Spread

Put this trade on for a credit of 2.10 back on 9/13.  This trade gave me a lot of grief and at one point went completely against me and in the money trading down to as low as $298.  I stuck with it through that process but closed it out on Thursday 9/19 for a debit of $1.89 which was a small profit.

My thinking at the time was that I was in the hole for so long on this trade, that I was relieved to get out of it at a slight profit.  However I did not follow my plan, and had I done so, I would have collected the entire $210 since the stock closed the week at almost $314, nowhere close to my short strike.

CBOE - 9/21/2013 - 45/46 Put Credit Spread

Put this trade on for a credit of 0.40 back on 9/9. For a good part of the time, the stock was above the short strike and looked like it would go out at max profit.  But I could not realize the full profit until expiration due to time decay and instead the stock came back against me.  I close this out on on 9/19 for a credit of 0.50 so took a 0.10 loss times 2 ($20).  Plan more or less followed on this trade.

FB - 9/21/2013 - 44/44.5 Put Credit Spread

Put this trade on for a credit of 0.25 back on 9/14 x 4 (4 contracts).  Since it was a 50 cent spread, it would be either a loss of $100 or a gain of $100, a nice easy 1 to 1 risk to reward ratio.  I closed this trade for a debit of 0.05 so I took an $20 profit per contract for a total gain of $80.  However, I did not follow my plan since the trade was no where close to being in the money.

PCLN - 9/21/2013 - 995/1000 Put Credit Spread

Put this trade on for a credit of 1.80 in part as a revenge trade on 9/19 for having close the NFLX trade to early.  My thinking was that if the stock closed above $1000, I would keep the entire $180 credit as profit. I closed the trade at about mid-day on Friday for a debit of 0.8 so I took about a $100 profit on this trade. So I did not follow my plan on this trade.

AAPL - 9/21/2013 - 460/465 Put Credit Spread

Put on this trade on 9/11/2013 for a credit of 1.80.  This trade took me on a wild ride trading down as low as $447 during the week which was completely in the money against me.  But I held on and closed it out on Friday for a debit of 0.03 with just minutes before expiration.  I mostly followed my plan on this trade, but left about 5 bucks on the table due to my own nervousness.

So I added it all up, and had I followed my plan, would have made an extra $331 which was the total amount I left on the table due to closing winning trades out at a small debit rather than letting them expire worthless.

Lessons Learned

1) Wait until Tuesday to put on Weekly Credit spreads.  Much of anguish I experienced this past week could have been avoided had I waited for better entry points.  Plus less time until expiration means faster time decay and left time to sweat out positions going against me.

2) Don't take a trade unless you get a solid signal on the daily chart.  I could have avoided badly timed entries in AAPL and TSLA instead of simply trading because the stock is "close to support" or "in a distribution pattern".

3) Give your credit spreads a healthy chance to expire worthless before closing them out at a profit.

Regarding this last one, the psychology of spread trading makes this difficult because you have to hold on for a smaller profit while leaving the table a chance for a much larger loss.  Consider PCLN - if you could take a $100 profit and avoid the chance of a $320 loss would you do so?  My risk-averse personality says reduce risk and take profits.  But doing so is the opposite of what you need to do to maximize profits.

Overall, I think I am on the right track but I still have a lot of work do to before I achieve consistent profitability.  I also have to work on my ability to "take heat" as positions go against me and still remain objective.

Enjoy your weekend and have a great trading week ahead.

Sunday, September 15, 2013

Active-Trader - My Trading Plan

Welcome back Active Traders and Wealth Builders.

After my breakout week 2 weeks back, I didn't do quite as well this past week.  In an attempt to analyze why, it occurred to me that I can't tell if I am executing according to plan, because I don't have one!  Specifically, I don't have a written trade plan which has been fully thought out and committed to paper.

Before I get to that, let me digress briefly on what trading is not.  Due to my training as an engineer, I used to think that trading could be automated.  Trading was a puzzle to be solved, and technology could help me solve that puzzle, and when I was done, all I would have to do is sit back and put up my feet and watch the money roll in.  Right?  Wrong!

Sure trading is being automated by high-speed algorithmic trading on Wall Street.  But I can't compete with those guys and there's no point in trying due to their built-in advantages.  So instead let's define what successful trading is for me:

Trading is a set of habits and behaviors, developed over time, which allow you to extract profits from the markets.

And good behaviors, when repeated faithfully over time, tend to become automatic.   So my job going forward is to develop those skills and work on my inner game.  And this trading plan should be a good step forward so let's get started.

1) Why am I still trading?

I trade mostly because I enjoy it, but also because of the chance to earn extra cash and improve the quality of my life.  Eventually, I will leave my full-time job and I plan to rely on trading to create and income to enjoy what life has to offer without having to worry about the money aspects.

2) When do I trade?

I trade between 9:30 and 10 AM and between 3 and 4PM on market days.  These times are when the best opportunities are found.  I also look at the market between those hours also and fortunately my full time job allows me to do so.

3) What do I trade?

I trade Weekly and Monthly options on stocks.  Fast moving, high priced stocks provide the best opportunity since they move around a lot and can easily move between strike prices in a single day.

My preferred strategy are options spreads where if I am bullish, I will sell a put credit spread and if I am bearish, will sell a call credit spread.

I will also occasionally buy directional puts and calls but limit losses to my risk limits described below.

I will also occasionally scalp stock and options for short, intra-day movements with very tight loss control.

4) What is my trading methodology

a)  Determine the overall market context.  Do this by first looking at the Daily, Weekly and Monthly charts of the major indices.   This will provide a backdrop for expectations for price movement

b) Determine the daily market context.  Are the Futures heading higher or lower in the Pre-Market?  Are their any important news announcements for today and when are they expected?  Are their any other calendar effects to be considered?  For example, Fed Day, End of Month, Triple Witching etc.

c) Determine the context for the tradable.  Review the charts and determine whether the tradable is expected to move higher or lower.  Extra consideration should be given to stocks with movements expected which are in confluence with the general market.

5) What are my entry signals?

I will focus primarily on the Daily charts for signals.  Entry will be daily patterns such as Key Reversal, Elephant Bars, Bounce off Support or Resistance, Close above the low of the High Bar, etc.  This mean don't just take a trade because it makes a new high or I think price is close to support or resistance.  Have an opinion on support or resistance, but don't take action until confirmed by the Daily Price action

6) What are my Risk/Reward parameters?

I will take spread trades when the credit is approximately 30% or greater the width of the spread.  Here are these values for various spread widths:

$5 - $1.80 max gain $320 max loss
$2.5 - $85 max gain, $165 max loss
$0.5 - $25 max gain, $25 max loss

Generally the higher the credit received the better, minus any amount the spread is already in the money.

7) When will I cut my losses?

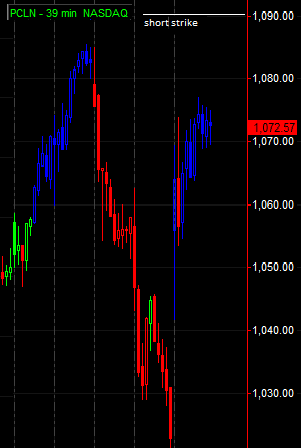
I will cut losses when it become abundantly clear that my short options will expire in the money.  I will wait until the day of expiration for this to happen to give the tradable the greatest chance of recovery.  I will attempt to close the trade before noon of the day of expiry for something less than the maximum loss.  If the tradable is close to the short strike give it time to recover.

8) When will I take profits?

For scalps, I will only take the trade if there is a high probability of price movement, and I will move the stop up immediately when the trade is in the money.

For long options, I will take profits when the price of the underlying reaches its target price.

For spreads, I will take profits once the spread reaches 80% of its max profit or if the short strike is in danger of going in the money.   Generally, I will try to hang on until expiration and let each trade go to maximum profit   This sometimes leads to a situation where a profit turns into a loss (AAPL this week) but avoids taking profits too early which can result in under-performance.

9) How much will I risk on a trade

For this year, I will stick with a Max loss of about 1% of my account on any given trade.  Since my account is about 33K, that means that I will risk a maximum of about $300 on a given trade which (conveniently) is very close the Max Loss on a $5 spread trade.  As I gain additional confidence, I will increase my risk profile in double increments (2%, 4%) until I reach a maximum of 10% for trades in which I have a high degree of confidence.

10) How many trades will I put once at once?

I will keep the number of trades to a manageable level, typically in the neighborhood of 5 trades, with an upper limit of about 7 or 8 open trades for any given expiration.   Given a rule of thumb of 5 trades, that means my max loss for any given option expiration would be about 5% of the account, and maximum gain would be one third of that or about 1.8% for that week.

Clearly, I have room to increase my trades size since I'm only using about 10% of the buying power in the account.  However, as I stated previously, my primary goal in 2013 is to end the year with a solid profit and build this account.  Longer term, if I can build this 30K account up to 100K, I will be in a solid position to use that as my trading stake for full-time trading.   I am clearly taking the slow road to financial success, but slow and steady wins the race.

That's a good start for my trading plan.  Think about your plan in your time off this weekend and have a great week ahead.


Saturday, September 7, 2013

Active-Trader - Amer Weekly 3d 0h 6m left

Welcome back Active Traders and Wealth Builders.

It was a breakthrough week for my trading career with my TradeStation account rocketing out to a new all-time equity high.  Overall the year to date performance is not that impressive at 6%, but I tacked on about 3% for the week which is pretty solid.

Its ironic because in last week's post The Mind of the Trader, I was bemoaning my lack of performance in this account.  Based on that I should blog about my limitations more often!

So along those lines, I still have some heavy lifting to do regarding my trading.  Specifically, I am not position sizing properly and taking profits too soon.  And a trade this week in YELP was a perfect case in point as follows.  John Carter was back from his European vacation this week and live and in person in the Simpler Options Trading room on Wednesday for the market close.  He saw a beautiful setup in YELP with the stock close to $56 per share and he put a short term target on at about $62.5 per share which was a Fibonacci extension of the recent pullback.

His response was typical and almost automatic: 1) Sell the at the money put credit spread, and 2) Buy delta 7 calls.  I followed along and sold 2 of the Sept 21 52.5/55 PCS in my TradeStation account and bought 1 YELP Sept 21 48 calls at about $8 in each of E*Trade accounts.  At the same time, Carter bought 200 of the same contracts in his account!

Based on my account size, 1 contract was 0.0029% of my E*Trade accounts or about 2 tenths of 1%. Based on JC's account size, his trade was about 10% of his account size which is about double the normal 5-6% of his account that he risks on a solid trade setup.

What happened next is even more interesting.  YELP gapped up on Thursday  to just below the prior all-time high at $59.  I sold 2 my contracts for about $10 and make $200 each.  Carter instead held on to his 200 contracts until Friday and sold them at $14.  So based on that trade alone, I made $400 and John Carter made $120,000!  How interesting is that - 2 traders presented with the exact same stock and exact same setup and 2 completely different outcomes!

So let's examine my actions here:

1) Why did I sell the YELP contracts at $10 when the stock was clearly short of its target at $62.50?

2) Why did I buy only 1 contract when (based on the 5% position size guideline) I should have bought about 20 contracts?

The answer is the same in both cases: Fear of losing money.

In the first case, I was afraid of losing my $200 gain and since it was only a $800 investment, a $200 gain is 20% in 1 day which is pretty good, right?

In the second case, I was afraid of losing the $800 since I have the mentality that when you buy an option contract, you have to be able to accept the complete loss of the premium paid.  For me $800 seems like a lot of money, but I can deal with losing $800.  But I can't deal with losing $16,800 which would be the amount at risk had I taken a position of about 5% of the size of my E*Trade Account.

I don't want to be too hard on myself because the future is unknowable.  And I have been trading long enough to know that you always have to be prepared for the worst case scenario.  But its clear that I am trading with the mentality of someone with a $20,000 account when in reality my account is many times larger.  How ironic is it that fear of losing money prevents you from making it?

Another thing I learned this week is the power of selling weekly options.  Consider these facts:

1) 80% of Options Expire worthless and Weekly Options expire every Friday.

2) Based on the pricing patterns, it makes the most sense to wait until Tuesday, then sell weekly option spreads based on where you think the price will not go.

In my case, I sold AAPL 485/490 PCS, the AMZN 285/290 PCS and the NFLX 285/290 PCS.   I all these case, all the stock had to do is close above the short strike (higher of the 2 values) for the trades to go out at max profit.   I took max profit in AAPL, but closed out AMZN and NFLX about 50 cents short of the full credit of 1.80 - more trading based on fear.

3) Once it the trade, all you have to do is wait until Friday expiration.  The passage of time works in your favor as you can see from the graph above.  The option premium decays faster the closer you get to expiration.  Keeping a cool head in these situations is something I need to continue to work on.  In many cases, I close the trade out early in an effort to lock in gains and minimize the chance of loss.

Enjoy your weekend and good trading in the week ahead.

Sunday, September 1, 2013

Active-Trader - The Mind of the Trader

Welcome back Active Traders.

Back on 5/22/2013 John Carter did a video on the Simpler Options web site on Trader Psychology. This video lasted only 16 minutes and 34 seconds, but it spoke to me more than anything else about what limits me as a trader.

Talking about your own limitations in a painful topic and I typically avoid it like the plague, particularly on my own blog where I always want to appear smart, in control and always making money. But that's the only way I'm going to advance, so let's get started.

First a little about me, I'm a 50-something male with a house, wife, mortgage and 2 kids, one of which just went off to college.  I have been working steadily as a technology specialist for large corporations for the past 25 years or so.  I am the epitome of financial responsibility with no debt (except for the mortgage on my house) and a respectable net worth for someone my age.  About 60% of my net worth is retirement assets put away diligently through payroll deductions. So far so good, so what's the problem?

The problem is my trading performance.  Almost regularly I under-perform the SP-500.  This year is a case in point where I am up about 6.6% in my taxable account and about 7.7% in my retirement accounts versus 14% in the SP-500, and that's on the E*Trade side.   On the TradeStation side, I am up about 3%. At my equity high, I was close to 5%, but I seem to be having a very difficult time getting out to a new all-time high.

I am never going to make it as a full-time trader with performance like that, and I'm not even sure that being a full-time trader is what I want.  But I have told myself I'm not going to leave my full-time job until I am making more money trading then through my regular job and I am clearly miles away from achieving that goal.

I have tried plenty of methods to make money, all of which were based on what worked for me in the professional world. Here's a quick recap:
  • Automated Forex Trading on Zulutrade with the results chronicled here.
  • Automated Forex Trading on MT4 with results chronicled on the accounts on the right side pane of this blog.
  • Various methods of system trading none of which produced anything worth risking my hard-earned assets.
Bottom line is none of those methods produced returns worth the effort it takes to carry them out. Algorithmic trading may work in the land of high-speed trading, but it doesn't work for me.

So now that we know what doesn't work, what does?

First regarding my performance, I shouldn't be so hard on myself.  After all, the world of money management is littered with those who can not out-perform the market and since trading isn't even my full-time job, why should I be any different?

Well all expectations changed with the arrival of John F Carter.  I always told myself I couldn't venture out on my own as a trader as long as I have a financial responsibilities of a wife kids mortgage, etc.  But here's a guy who is younger than me, certainly less technical and probably less educated than me but who regularly withdraws about 2% a week from his accounts.  Last week, (when he was on vacation in Italy) he wired out about $35,000 which is about 2% of his low 7-figure trading account.   Based on that, he can earn about 1.75 Million a year and still keep his account hitting new equity highs. In his own words, he treats his trading account like an ATM machine.

Before the arrival of Mr Carter, I would have told myself that this type of performance was not possible,  but he regularly provides undeniable evidence that it is possible. And the video above speaks to what limits me as a trader.  What's even more amazing is that JC seems to go about his life in an almost entirely stress-free manner.  He cares about the money, but it doesn't seem to cloud his thinking in the least.

So let's get right to my limitations:

- I am analytical by nature and I consider life's problems to be a puzzle.  The presence of the puzzle leads me to a state of higher stress and uncertainty,  and resolution of the puzzle leads me to a state of lower stress and uncertainty.

- I am extremely financially conservative and would rather work hard to earn $1 with a 100% degree of certainty than to work 20 minutes for 60% chance of either making $1 versus a 40% chance of  losing $1.

- I am attached to the security that having money in the bank brings, and therefore losing money is more painful to me than making money is pleasurable, particularly if I have to risk money to make money.

As JC put it in the video above, Trader Psychology is the final frontier in trading and you are not going to advance as a trader unless you address the self-limiting beliefs that hold you back.  In my case, I have a strong need to "be right" and for me being right means making money and not losing money.  

I want to end 2013 with a positive balance in my TradeStation account to prove that I am "right" and can make money trading.  Unfortunately, this need is so strong that I am always trading like I am just one trade away from poverty, when in reality, nothing could be further from the truth.  

To make money, you need to stay impartial.  If fear of loss dominates your state of mind, then your mind will manufacture fearful solutions.  Fear of loss clearly dominates my state of mind (at least in my TradeStation account) and as a result, I have a lot of work to do before I can become consistently profitable as a trader.

Sure, having the right indicators and setups and execution is important.  But most important is your state of mind when you are trading. Unless I overcome that, I am never going to advance as a trader.

Enjoy your weekend while I address my inner daemons.