Saturday, August 25, 2012

Meta-Trader - 0.625

Welcome back, Meta-Traders.

Sometimes I get a bit goofy over numbers.  After all, they are just quantities and one quantity should get pretty much the same consideration as any other quantity, right?  Wrong!

On our way from counting from 1 to 10, we reach the number 6 which it turns out is pretty close to 0.618 times 10 - and 0.618 which is approximately the ratio between any 2 numbers in the Fibonacci sequence.   And I know from years of watching the markets that advances often pause, and sometimes retrace, at 0.6 times the a magnitude of an advance.  Like anything else it the markets, its not a hard and fast rule, just a limit to keep in your mind sort of like support and resistance.

When a stock goes from 20 to 1000, it will have to stop is the 600's.  And when a stock is going from 600 to 700, its going to have to stop somewhere at about 660.  And that's where we are with my favorite stock Apple Computer which this week reached the 660 mark, and then took a rest.  At that point, I decided to take some profits, since they came fast and easy.  At that point, the stock pulled back to about 650, then worked its way higher and closed the week at about 663.  Then after the close on Friday, the jury ruled in the Apple vs Samsung patent infringement case.  Apple won big and the stock close just short of 675 in after hours trading on Friday!

You know I have been on the Apple case for some time.  Not long ago on this blog I remarked that Apple was the second highest capitalization stock on the market just below Exxon Mobile.  Since then Apple is now the biggest cap stock ever in history at 581B, bigger than Exxon Mobile by almost half.   Its market cap is now more than double that of competitors Microsoft and IBM and almost 3 times that of tech titan Google.   Apple is a mega-trend in itself and its obvious what you should do, wait for a pullback and buy some deep in the money calls.  After a pullback to point of resistance (now in the 660 area), next stop is 700 on its way to 1000.  Don't over think it, Meta-Traders.

Forex showed some signs of improvement this week, with finally a winning trade in Atipaq USD/CHF after a long series of losers.  It seems, in some ways, the market has "learned" this system, and seems to find a way to hit its stop losses in the course of slopping around in the directionless Forex action we have seen lately.   Every system goes through losing periods but the question - whether I will be around long enough to withstand the draw down - remains to be answered.

Anyway, Daniel Fernandez will be coming back from Europe in a few weeks.  Perhaps his return will ride to the rescue of our Automated Forex career, and snatch victory from the jaws of Forex Failure.

I am more convinced then ever that adaptive trading algorithms - those which change their tactics based on what has worked recently - are the way to go.   The only system on Asirikuy which meets this description is Sunqu.  And all 4 accounts on Asirikuy are up - albeit modestly.   More to come on this topic.

Enjoy your weekend and what's left of the Summer of 2012.


Monday, August 20, 2012

Meta-Trader - AAPL Day Trade

Welcome back, Meta-Traders

I hope you took my advice from the weekend post to buy some Apple computer.  The chart on the left shows 5 minute bars with 3 moving averages: 8-period, 21-period and 50-period.   Check out the way we had a large opening candle followed by a partial re-tracement.  After that, it hugged the 8-period moving average all the way up the large red candle about 11:15 AM.  Perfect trading conditions for Oliver Velez type day trading.

After that sell off, AAPL went into a complex correction which eventually found support right at the 50-day moving average. Finally it closed at a new all-time high on the closing tick. A classic example of 'painting the tape'. 

Apple is now the largest capitalization stock of all time and has exceeded Microsoft and Exxon Mobile with this latest move.

I'm still long and expecting some further upside tomorrow before a blow-off top later in the week.

Sunday, August 19, 2012

Meta-Trader - AAPL New Highs

Welcome back Meta-Traders.

As you know I am a big fan of Trend Following. I like it because its pretty easy all things considered. You don't have to be particularly clever, or hard working, you just need the simple power of observation. And the stock that has made me more money than any other stock is - your guessed it - Apple Computer!!

Apple staged a major breakout this week by eclipsing the prior all-time high at $644 set back on April 10th. This move corresponds with 4-year highs in the SP 500 and Dow Jones Industrial Average.  I didn't take as full advantage of this move as prior trades - using options - but I was (and still am) holding some AAPL shares in anticipation of more new highs.  

Last quarter's earnings in AAPL were a bit of a disappointment with earnings come in lighter than expected.  That accounted for the sell-off we see on the left hand side of the chart.  The word on those earnings is that sales of the iPhone were light because users are holding out for the introduction of the iPhone 5 - which is expected in the first few weeks of September.  There's also talk of another, smaller iPad and a new version of Apple TV!   If AAPL can do for the TV what they did for the cell phone, they could have a major hit on their hands.  Bottom line is APPL is coming into the fat part of their product cycle, and the fat time selling season (back to school and 4th Quarter) which are traditionally their strongest.   And with a 5-year earnings growth rate of 60% and a PE of 15, the stock is still absurdly cheap.  Next stop is $700 a share and beyond with an ultimate price target of at least $1000.   Don't bet the farm, but don't miss out either, this one is obvious.

And speaking of the obvious, Forex is going the other way with new equity lows in 3 of the 4 systems I am trading.  Let's review the damage.

Atinalla #1 is the only account still holding into gains and actually had a small gain for the week. While its down about -5.61 year to date, its still up about 23% since starting it back in November of 2010.

Atipaq Full Portfolio continued its losing ways, and is now down nearly 42% for the year and -12.46% since start up back in January of 2011.

Atinalla #3 is now down -22.84% for the year and -22.5% since start up back in January of 2011.

Finally, Atinalla Custom is down -26.49% for the year and a down as nasty -42.28% since start up back in November of 20.10%

No action in COATL H1 and Sunqu Live which are stopped.

Totaling the damage, I'm down just over $3000 on a $20,000 investment which is minus about -15%. 

Overall, its not as bad as the individual performance numbers would suggest. I'm going to continue to let the systems run since I recall at times in 10-year back tests, systems go into draw down that looks so nasty, I wouldn't have been able to stand it. If these systems are truly long-term profitable, then they should eventually assert themselves to the upside, right? We'll see, but in the meantime, I'm not committing any more money to Automated Forex Trading.

That's all for now. Go buy some AAPL, even its just 10 shares.  It will soothe the pain of money lost in Automated Forex Trading.   And have a great week.


Saturday, August 11, 2012

Meta-Trader - The Gapdicator

Welcome back Meta-Traders.

Taking a look at the way the markets have been behaving lately, we see a higher than normal instance of price gaps.  Gaps occur when today's low is higher than yesterday's high or when today's high is lower than yesterday's lows.  Since we are seeing more gaps, I thought it would be interesting to know just how many more than normal?

To find out, brought up TC2000 and added the gapper's indicator which is shown on the chart to the left when applied to symbol EFA which is the iShares MCSI EAFE Emerging Markets Index fund.  I picked this one since it seems to have a higher degree of price gaps  The primary gaps indicator appears above and spikes back and forth between 0 and a max of about 1.92 due to a squashing function.   I then overlaid a 20-period moving average and came up with the Gapdicator - or Gap Indicator.

For the EFA, the indicator is nearly 0.5 which is quite high.  For the S&P 500 EFT SPY, its closer to 0.3.  For most typical stocks with little price gapping, its much lower.  Here's a quick summary:

EFA - Emerging Market's ETF - 0.48 - Relatively high but historical high as high as 60
AAPL - Apple Computer - 0.25 - Moderately high but lower than historical high at .45
SPY - S&P 500 ETF - 0.3 - Elevated and sustaining highs
Most stocks - 10-15 - With occasional moves up to 20

What does this mean for our trading?

  • Day traders miss out on the full extent of the gain because they don't harvest the gap on the long side
  • Market is thin due to summer vacations etc.  Its also worth pointing out that volume on the stock exchanges is reaching record lows.  Other than the high frequency traders, most of the public is hiding out in Mutual Funds, ETF's or bonds.   As a result it seems to be either risk-on, or risk-off depending on the latest news from the Euro Zone.
  • Results are terrible for Forex for breakout systems which is getting whipsawed back and forth.  Its so bad, I haven't even looked at the results for the week, i'll update it later.
As a result, I have become sort of disengaged from the Stock and Forex markets lately.  Also, I'm coming to crunch time on several projects with my regular job which are keeping me hopping.  So I haven't had much time for extracurricular development lately.

But its worth pointing out that stocks seem to have lifted the lid on the recent range and broken out to the upside.  And the S&P daily chart is moving in a channel and to the upper right at about 37 degree angle.  

Whatever stocks are doing, its also worth pointing out that the 2% yield in the S&P 500 exceeds the 10-year treasury by 40 basis points.  In the end, dividends are what make stocks the place to be regardless of what the charts are doing.

Also keep in mind that the central banks can produce an almost unlimited amount of money - as long as inflation does not become a problem.  The European bankers don't seem quite as willing to create money as Bernanke and the Americans.  But when push comes to shove, they will do whatever it takes to keep the Euro, and the entire modern money economy from falling apart.  

That realization, plus a dose of potential optimism that Romney might win, are enough to keep a bid under stocks.  Have a great week.

Sunday, August 5, 2012

Meta-Trader - Forex Failure Analysis

Welcome back Meta-Traders.

Daniel  Fernandez once commented in one of his e-books that the psychology of Automated Forex Trading is one of the most difficult parts.  There's nothing difficult about making money of course, in fact what could be easier?  You just put up the robot and sit back and count the profits!

But what about when they lose money?   Its not like we arrived at these systems haphazardly.  After all, they are carefully selected from at least 10 years of back testing, with favorable risk/reward ratios, ATR based position sizing, robust coding techniques etc, etc.  And these systems were back-tested, forward tested with demo money then forward tested with real money which was earned and saved by your humble blog author.

When systems fail, the questions start to arise such as:

  • Are the systems working properly?
  • Has the underlying structure of the market changed rendering the systems no longer effective?
  • Are the forex brokers hunting my stop loss orders and since the market makers can see my stops, or put another way, is the forex market really fair?
  • Is is even possible to trade the forex markets profitably using Automated Forex trading? Sure we have 10-year back tests that are profitable, and data provide by the industry, but do we have any actual live results we can point to?
And that's when FUD (Fear, Uncertainty and Doubt) start to creep in.

Fortunately, we have plenty of data to examine the behavior of our systems.  We can compare the behavior of different instances of the same systems on different brokers.  We can also compare the behavior of systems versus their historical performance such as maximum draw down, consecutive losses and win/loss ratios.  Using those tools, let's see if we can come up with some answers to determine if we are just looking at a bad period of performance, or the entire Automated Forex Trading experiment is just low-hanging fruit for the market makers.

At the heart of my poor performance is the Atipaq USD/CHF instance which is embedded in 3 of my 4 live portfolios.  The box in the upper left shows the year-to-date performance of this instance in my Atipaq Full Portfolio account.  Atipaq USD/CHF is one of the best performing instances historically with a 16% average annual profit and a maximum drawdown of 22% on a 10-year basis.  On a year to date basis, this instance is down 17% which is not even that bad compared to its 10-year historical maximum of 22%.

To be fair, Atipaq USD/CHF had a good year in 2011, with returns of about 17% with drawdown less than 10%.  This lead the Atipaq Full Portfolio to an excellent year in 2011 and was up nearly 50% for the year.  And at one point, the portfolio was up nearly 96% from the start before it crashed and gave back all those profits and just went negative this past week when considered from the start.

Now let's try to tackle the above questions one by one:

1) Are the systems working properly?

Yes, this is clearly the case since I'm seeing consistent trading between my different instances as well as the similar systems on Asirikuy.  I'm not allowed to reveal specifics of the performance of systems on Asirikuy, but let's just say they are similar to what you see above.

2) Has the underlying structure of the market changed such rendering the systems no longer effective?

To examine this, we need to understand how Atipaq works.  Basically, it builds a box based on the range of price behavior over the Asian session, or some number of hours before the active period for the pair.  Then it basically buys or sells breakouts from the box with a TP being some multiple of the box size and the SL being the opposite side of the box.  So the real question is, how often does price movement, after breaking one side of the box, return to the opposite side of the box before hitting the TP?  It turns out the answer to this question is pretty much the win/loss ratio of the system.

The table on the left shows the win/loss ratio for Atipaq USD/CHF for the past 10 years.  Years 2002 through 2010 are based on back-testing and the figures for 2011 and 2012 are based on actual trading results.  

From the 10-year backtest, the win/loss ratio averages about 50/50, meaning it wins about as often as is loses on a historical basis.  For every dollar the system makes on winning trades, it loses about 60 cents on losing trades.  That means the system has to win only about 40% of the time to earn a profit. And we can see that for most years, the system wins  better than 40% of the time.  The only exception was 2007 where the wining % came in just under 40%

For 2012, Atipaq USD/CHF is on the losing side on nearly 7 out of 10 trades. And since the win % is clearly under 40%, the system is losing money overall.

Anyway, what this table shows is that the Win/Loss ratio for Atipaq USD/CHF is lower now, on a year to date basis, than its been any time in the past 10 years. 

3) Are the Forex Brokers hunting Stop Orders?

This one is pretty easy and is detected like this.

If the price has a single hourly candle averse move to briefly visit the price area, take out the stops then retrace back to the prior price area, the move is suspect.  Also, there would be no other trades before or after the suspect price movement for a number of bars. Unless there is a news event, there's no other explanation and its easy to see on a chart.  This particular spike may have been accompanied by a news event, since EUR/USD had a similar spike, but I can't be sure which one in retrospect.

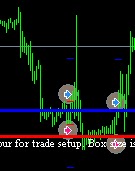
Just how big is that hourly bar on the chart?  The range of the bar is 125 pips, versus the 14-bar ATR of the daily chart which is 140 pips.  Thus the range of that single bar represents 89% of the daily average true range of the pair!

When I started this blog post, I was suspicious that this type of price bar has caused me to lose money in GBP/USD trades lately.  Upon closer examination (using with the "browser" feature of MyFxbook), I found that I actually profited on these price spikes, once on 8/2 in GBP/USD and again on 7/27.  Also, I closed out a profitable long position in AUD/USD at the high price of that spike.

Can anything be done to put an end to stop hunting?  Well the systems can be modified to not submit stop orders and go with the broker default stop of 500 pips  The Meta-Trader systems could execute the order when the price reaches the given Stop Loss level.  This is higher risk, however since should our Meta-Trader platforms fail, we could be subject to an account-wiping adverse movement.  Also, we would still be subject to these stop-hunting price excursions since the market makers are going after much larger players then ourselves anyway.

In this end, while stop hunting is a negative for Forex as an asset class, its just as likely that we would profit from a price spike as lose money.

4) Is it even possible to trade the Forex markets on a long term basis profitably using automated systems?

In the past Daniel has pointed to data provided by the industry which indicates that Forex trading is long-term profitable by either manual or automated trading.  Its hard to trust data provided by the industry itself, and instead, I am inclined to trust data provided only by real, small investors such as myself.  I suppose the jury is still out on this question, and time will tell.

Not to be all doom and gloom, I'm having a pretty good year in equities, and Fridays +1% moving in the emerging markets ETF's EEM and EFA ended the week on a good note.

Enjoy the rest of your weekend and the coming week.