Sunday, March 6, 2016

ALXN turning positive

Welcome Back Traders.

Shares of Alexion Pharmaceuticals have turned positive after a bruising start to the trading year.  The shares are down about 24% on a year to date basis.

Note how the range bands indicator has gone from green to blue indicating that an uptrend is now in place.

Also note how the awesome oscillator has crossed the zero line to the upside for the first time since 10/23/2015.  The last time that happened, it lead to a nearly 20 point rally in the shares.  Last years rally was anything but smooth so size accordingly and be prepared for a bumpy ride.


Sunday, February 7, 2016

Facebook Round Trip

Welcome back loyal blog readers.

This continues to be a year of wealth destruction for the longs in the stocks market.  Many observers have noted that the broader market has been decline for some time and only a handful of stocks (often called the FANG stocks - Facebook, Amazon, Netflix and Google) have been holding up the market.

You can tell the party is over when even those stocks get slammed, and even when they report good news.  A case in point is my favorite Facebook FB.  After earnings, it gapped up into new all-time high territory, taking out the old high at the gray line just short of 110.50.  After that it rallied up to the next gray line at 114.86 and even exceeded that brushing up against a 4th level of Fib Lines which is not currently included in my FibLines indicator.  Based on this price action, I may have to reconsider that decision.

In any case, Facebook then exhibited an almost perfect 3 bar reversal pattern and that level and turned south just to find support at the red line at 103.15 which is the 161% line in the FibLines sequence.

Next up is Amazon which recently reached an all-time high at $695 a share.  Those earnings were not good and the stock sold off hard.  The shares currently are trading at about $500 a share, off a stunning 28% from levels seen a mere 10 days back.

Next up in Netflix, off 36% from the top made earlier in December of 2015.

Last up is Google, another company that reported excellent results, and the shares also got spanked.

Check out how they got turned back at the orange line which was the last of the lines prior to the conclusion of the entire FibLines sequence.

You know its a nasty market when stocks reporting good news get punished along with those reporting bad news.

As for now, keep your powder dry its going to a long and nasty year for the bulls.

And BTW, you can get both the free and paid versions of the FibLines indicator over at my site at http://fibtools.blogspot.com.

Have a great week a preserve your capital.


Sunday, January 31, 2016

Announcing Fibtools.com

Welcome back loyal blog readers.

After many months of working on the FibLines indicator and giving it away for free to members of my Yahoo Group, I am ready to launch the paid version.

You find find my new site at:
http://www.fibtools.com.

You can find the online store at:
https://fibtools.selz.com.

FibLines help to identify hidden areas of support and resistance for most major stocks, ETF's Futures and broad stock indices by plotting lines on the chart.

FibLines are based on the principals of Elliot Wave and Fibonacci.  For a complete explanation, see my video Introduction to FibLines.

Fiblines are available as a both a paid and a free version, both available at the FibLines Store on Selz. Both versions support Thinkorswim and TradeStation v9.1.  The free version supports DIA, SPY, QQQ and IWM along with the continuous futures symbols /YM, /ES, /NQ and /TF.

The paid version supports over 220 symbols include most major stock market indices in the US, the Dow 30, the Nasdaq 100, and a number of key other markets and commodities including Gold, Oil, Interest Rates, Health Care stocks, Select Sector SPDR's, Dollar Index, etc.  The indicator also includes a text file with the list of supported symbols, so you can import the text file to create watch lists.

The paid version costs $99 and includes one year of maintenance.  Recall the FibLines are created in part based on human interpretation.  Markets change, new symbols come and go, and the lines need to be adjusted going forward for example with stock splits.

Enjoy the indicator and have a great week ahead.

Saturday, January 23, 2016

Bottom in Oil?

Welcome back loyal blog readers.

It was a tumultuous week and the markets appear to have put in a least a short-term bottom.

Wednesday's price action was wild - at one point down 65 points S&P points, just to rally most of the way back. It had the feeling of a panic flush to the downside, a cleanse to shake out the last of the weak longs.

Lately it seems the price of oil has been leading the stock market, and needless to say its been brutal of those in the oil production business and stocks alike.

Anyway, I bring it up because the Crude Oil Futures (/CL) is at the 423% line at the bottom of the sequence.  So this is an important level at which we expect some type of price deflection off of the line giving some relief for the oil longs and oil stocks.  Plus we are approaching a seasonal low in energy prices in mid-February.  But given the adequacy of the supply, it could still be quite some time before supply and demand come back into balance and put a bid under energy prices.

In the meantime, enjoy the low oil prices and good trading.

Sunday, January 17, 2016

Markets on the Brink

Welcome back loyal blog readers.

Recall from last week's post Welcome to 2016 - Chain Sawed that I expected the market to find support at the next orange line on the FibLines indicator at about 1880.

Looking at the chart, the orange level was 1880.42 and we closed the week at 1880.33 just 11 cents from that value! I think that's pretty amazing but I'm not surprised given the accuracy that I have observed with the FibLines indicator in the past.

Of course you could have come to a similar conclusion by observing that the SPX found support at this level when we had sell-offs back in August and September of 2015.

So what happens next?  I think we have seen the majority of the selling for now and we are overdue for a rip-the-shorts-face-off rally back up to about 1958 on the SPX or even up to the breakdown point at about 2007.  Of course is also possible we could plunge another 50 points to the 1830 level to inflict maximum pain on the longs and force some mass capitulation.

As for now, I have a fairly high cash position.  I also have on an SPX March 1175/1170 Put Credit Spread. This was a trade from BIAS that I held off on and ended up getting a better fill than Bruce. After an easy start with BIAS back in late 2015, its been a rocky start to 2016 but I'm going to hold on and learn as much as I can in the process.

Enjoy your Monday holiday off from the markets and keep your powder dry.

Saturday, January 9, 2016

Welcome to 2016 - Chain Sawed!

Welcome to 2016 blog readers.

So far is been absolutely brutal for long-side investors.  We got a sell-off straight out of the gate on Monday and it hurt, but was not unlike the sell-offs we have have seen previously.

Most stock investors are familiar with the concept of "turn around Tuesday" where we get another round of selling on Tuesday morning then find a bottom and stabilize.  That seems to happen on Tuesday where at least the selling took a break.

Wednesday brought another round of nasty selling. That took us down to about the 2000 level on the SPX and not far from the 3rd level fib line support at 2007 which has provided some support in the recent past.  At that point, the selling had also reached symmetry with recent sell offs in terms of magnitude so we expected a bounce and some stability.

Did we get it?  No.  We had some hopes of stability on Thursday when the Chinese market removed their 7% circuit breaker rule which had seemed to inflame the selling and prevent the orderly working of the market.  That seemed to help in the morning and we had some hopes of stability.

Next up was Friday's employment report which was actually pretty good as should have been the catalyst to rally.  We saw a rally in the morning, but it soon faded and we turned negative and accelerated to the downside into the close. Even Bruce from the BIAS service on Simpler Options threw in the towel and conceded it was a worst case scenario for the markets.

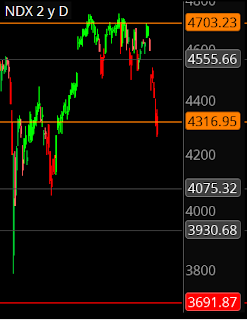
Looking at the larger picture, the next likely level of support is 1880 on the SPX which you can see in the chart above. The NDX fared slightly better and we seem to be at a point of support at the orange line there.   We are also found some support at the 261% line on AMZN and the 161% line on AAPL, so I think we have seen the bottom in the Nasdaq for the time being.

At times like this, all you can do is control your risk and find ways to vent your aggression.  In my case, I found comfort in my brand spanking new Husqvarna 440e chain saw.  I took it as an opportunity to clean up some fallen and storm damaged trees around my properly.  I find being outside and doing physical work to be very therapeutic and the mild winter temperatures are providing a good opportunity to do so.

As for the FibLines indicator, I am working on some methods to determine, algorithmically, how well the lines work on a given chart.  This will open up some objective ways to measure how well they work as well as ways to use them in scans and use them to give trading signals.  I'll save the details for another blog post.

That's all for now. Count your blessings and live to trade anther day. And enjoy these low energy prices.


Sunday, January 3, 2016

Free FibLines for Thinkorswim

Welcome back loyal blog readers and Happy New Year!

2015 was a busy time for your humble blog author as I continue to enhance the FibLines indicator to prepare for an official launch later in 2016.  There is much to done beyond just creating the product.  So rest assured I have been hard at work behind the scenes to make it happen.

Along those lines, I decided it would be a good idea to create an introductory video that explains how the FibLines indicator works.  So I am pleased to present the video which you can view on YouTube here.

Also, I uploaded a new version of the FibLines indicator to my Yahoo group with some changes as follows:

- Indicator supports only SPY, DIA, IWM, /ES, /YM. and /NQ.  This will be the free version of the indicator going forward.

- Color scheme has been updated as shown in the graphic.

- Corrected some calculations on the 2nd level (Orange) lines which were incorrect.  Thanks to an astute member of my Yahoo group for pointing that out.

This new version is available to members of my Yahoo group under the name FibLinesFree.ts and the prior version which contained all of the levels has been removed.  If you wish to maintain the levels yourself going forward, you can do so using this new file as a starting point.

In the meantime, check out the video and let me know any comments.

Also, you can get a copy of the FibLines indicator for free by joining my Yahoo group, just send an e-mail to fx-mon@yahoogroups.com.

All the best to you and your family for a fantastic 2016!

And of course good luck with your trading.