Friday, April 26, 2013

Meta-Trader - The Earnings Miss

Welcome back, Meta-Traders.

As you know by now, I am mostly a stock trader.  And nothing strikes fear into the heart of the long-side stock holder than the dreaded earnings report.  This is the single most important news event for any individual stock.  And it comes just 4 times per year just as surely as the rotation of the Sun, Moon and the Earth which governs most of our other natural cycles.

What makes the earnings report so important is that it is so rare.  There are about 250 trading days per year in the stock market and only 4 of them are earnings days for any single stock.  That means an earnings day is a 4/250 event or put another way only occurs about 1.6% of the time.  And that spells opportunity for the astute trader in a few ways as follows:

1) The Earnings Miss - This happens when a stock with good fundamentals and a good chart etc releases earnings which don't live up to expectations.  This is especially common when the stock had a big run-up into earnings, see below for that.  In any case, the stock is unduly punished and sells off hard in a manner disproportionate to the rest of the market.  In the above case, IBM sold about 5% on the earnings news which was way beyond the fraction of 1% move in the general market.

Anyway, the Earning Miss provides a buying opportunity for the astute trader, as long the earnings news does not contain any substantial fundamental developments affecting the company.  This means you should read the earnings report and/or listen to the earnings conference call before forming your opinion.  You don't need to have an MBA or understand what is meant by SG&A.  Just listen to the call, read the news and form your opinion, its not that hard.  In my case, I decided to buy IBM at the blue bar above and I am sticking with it for a gap fill up to about 207.  That may seem like a big move, but remember, IBM is a Dow-30 stock with really good management the indexers have to buy it.  They have no choice.

2) The Run-Up into Earnings - This happens when a great stock with great fundamentals runs up into earnings. Case in point is Amerisource Bergen (ABC).   This stock has solid fundamentals, 5-year earnings growth of almost 20%, PE of about 19% and a yield of 1.6%.  Its always encouraging to see a stock with a 5-year earnings growth rate greater than the PE.  Cramer says you can pay a multiple of up to 2X the PE, so stocks in this situation are undervalued and can rise substantially from here.

All that being said the earnings date can make or break the play. In the case of ABC, I bought into the run-up ahead of earnings and sold right into the rally at about $56.70 the day before earnings came out. The earnings were not bad, just not stellar and that was enough to knock the stock down and I re-loaded at the blue bar above.  Sure the stock can drop from here - and it did in my case.  But you have to have conviction in the story based on your own research.  If you don't have conviction, don't take the trade.

3) The Sell-Off into Earnings - This happens when a stock with pretty good fundamentals sells of before earnings in anticipation of bad news.  Once the new comes out, sometimes the news was not quite as bad as expected and the stock rallies..  Case in point in my favorite Health Care cost containment play HMS Systems symbol HMSY.

Check out the daily chart of HMSY.  The stock recently sold off hard on the daily chart from a high of 31 and change all the way down to about the mid 22's.  I almost sold the stock ahead of earnings because it looked so bad.  But listening the earnings call,
I understood that the earnings miss - which was predicted and realized - was based on short term uncertainties related to adoption of government-reimbursed health care contracts which is the core of the long-term story behind this company.  Net result was a buying opportunity and I bought on the blue bar shown above.

Granted I could be totally wrong on all of the above plays.  The stock market could go into the toilet based on terrorism macro or other unexpected factors leading to a big loss of my principal.  But we are in a major bull market and learning and understanding the fundamental factors behind you investments give you conviction to stick with the story or even buy when the charts look bad.

Okay, I'll get off my soap-box now.  Enjoy your weekend.

Sunday, April 21, 2013

Meta-Trader - $TICK, $TIKI and $TRIN

Welcome back Meta-Traders.

This past week was a bit rough in the markets for your humble blog author.  The market was down big 3 of the 5 days and the 2 intervening up days barely made up for the down days.  As you know, I'm mostly a long-side player so I took a hit.  It was more like just giving back some recently gains which is not at all unexpected after all this bullishness we have had lately.

Last week's "continuation trade" in LNKD was a bust and I ended up giving up the entire premium over just over 7 bucks paid.  Loss control was poor on this trade as I wanted to exit with a stop around 5 for a max loss of 2 or about $200.  But instead, I let it go to zero and lesson learned for long option trades is to always have a stop loss pointed selected ahead of time and stick with it.  John Carter points out in his excellent book Mastering the Trade, that managing exits is the difference between amateurs and professionals in this business.

On the positive side, I did okay with the "Morning Scalp" trade in my TradeStation account where I seem to be holding myself to a much tighter standards.  I did one trade on Tuesday in the AAPL 430 puts and was stopped for a 1 point loss.  I did another trade on Friday in the AAPL 410 puts where I bought for $9.87 and sold for $12 a few minutes later.  Had I held onto that trade until later in the day, I could have sold it for $18 and made $800 instead of $200.  In any case, I continue to hold gains my TradeStation account which is up about +11.2% for the year edging out the S&P by about 2 points.

As for personal development, I got through the chapter on "Reading Market Internals" in Mastering the Trade and found out some really interesting ways to interpret intraday action.   In the past, I found myself often reacting to price action alone, just to buy at the top tick of the day and wondering why I was left holding the bag.  Read on for a quick recap of these 3 intraday indicators available in TradeStation.

$TICK

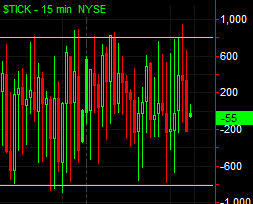
Ticks summarize the number of stocks on the NYSE increasing in price versus those decreasing in price.  The number typically ranges between -600 and +600 with occasional spikes to -800 or +800.  Very rarely we see moves to -1000 or +1000.   Extreme readings in either direction indicate that buying or selling has reached extremes and can be used either to prematurely close long or short positions which are in the wrong direction, or to exit positions in the right direction at a profit.

One cool feature of TradeStation is that you can setup audio alerts when ticks reach extreme values.  In my case, I setup the "Cash Register" sound when ticks reach +800 and the submarine "Dive Horn" when ticks reach -800.  Ticks also give you a clue as to overall market strength or weakness.  For example, if ticks spend most of their time above 0 with occasional spikes above +800, that is positive for the markets overall.  Looking at the graph above, which was Friday's action, it was pretty much a mixed bag but slightly positive with a few +800 readings.

For another example, look at the graph on the left which was Monday, April 15, 2013.  Note how Ticks spent most of their time in the lower half of the chart with a few excursions below the -800 mark.  +800 was not reached until the last few 15-minute bars of the day, probably not until about after 2PM EST.

$TIKI

TICK is the same thing as the Ticks, but only for the 30 stocks in the Dow Jones Industrial Average.  As such, its values will range from -30 to +30.  John Carter sets audio alerts on these at -30, -28, -26, +26, +28 and +30.  These levels corresponds to levels at which program trades are being executed which would simultaneously push down (or up) all 30 Dow-30 stocks at the same instant.  Program trades are not the primary driver of price action, but can result in short term moves one way or the other. John Carter uses TIKI as a "heads up" only, but leaves the actual signal to the Ticks.

$TRIN

TRIN is probably the most confusing of these 3 indicators.  Its also known as the ARMS index named after its founder Richard Arms and is calculated as follows:

(advancing issues/declining issues) / (advancing volume/declining volume)

In other words, this is a ratio of a ratio and ranges between 0.5 .. 4..  Lower numbers mean bullish markets and higher numbers mean bearish markets.

Hubert has some rules regarding TRIN based on the closing values such that if TRIN closes at high values indicating extreme bullishness, he will go short into the close expecting a lower open the next day.  Conversely, if the TRIN closes at low values for the day indicating extreme bearishness, he will go long to the close expecting a higher open the next day.  I don't have the exact parameters for this setup, so I will hold off on that for a future post.

That's all of for now, enjoy your weekend and good trading.


Saturday, April 13, 2013

Meta-Traders - 2 Trading Setups

Welcome back, Meta-Traders.

It was another spectacular week of trading with my net worth hitting new highs several times during this past week.  The Dow Jones Industrial Average made new closing highs every day of the week but Monday and the SP-500 made new all-time closing highs on Wednesday and Thursday and gave some back on Friday.

One thing I have learned from being associated with John Carter is that good traders have a library of setups in their arsenal.  And they simply scan the markets at the key times and look for these setups.  Here, I will give you 2 setups that worked for me this past week along with some examples.

The Morning Scalp

This trade is done with options and on fast moving, high priced stocks.  I do these in my TradeStation account only since you have to be very nimble and profits could come and go in the time it takes to hit the refresh button on the browser when accessing your web-based broker.  Here's what to look for:

Set your charts to a 5-minute time frame and watch the first 5-minute bar of the day.  Be careful if there is a price gap between yesterday's close and today's open.  In the above case (which was GOOG on Wednesday), there was no price gap. Also note the first bar of the day was a large, green bar or in Oliver Velez Parlance, a "bull elephant" bar, so the bulls are clearly in charge.

Next, find the cheapest option you can find with a delta of 0.7 or above.  Use the closest expiration date you can find since you will be in and out of this trade in minutes.  In the above case, I chose GOOG 130412C765 which was the weekly 765 calls.

Next, wait for the pullback which a counter-trend move caused by profit taking by all the professional traders who take the other side of the opening price action.  Set a limit order inside the spread and wait for a fill.  Don't chase the price action and put in a market order since this increases your chances of being fresh meat for the market makers.  In my case I was filled on the GOOG 765 call at limit of 16.

Once filled, put in your stop loss order.  I chose a stop of $1 or $100 and was going for a take profit of $2 or better. Once the trade is on, only 2 things can happen, either you get stopped out, or you take your profit.  On the above trade, I came within $10 of being stopped out, just before the price reversed and headed higher, so I lucked out somewhat.

I did this trade 3 times this week:

GOOG 790 puts where I risked $100 and made $200

GOOG 765 calls where I risked $100 and made $300

REGN 200 calls where I risked $100 and lost $100.

This last one was a learning experience since the bid-ask spread on the REGN weekly calls was nearly $100.  I put my limit order in at 12 and got a good fill.  I put my stop order in and got stopped out almost immediately since the $100 was nearly the spread itself!  So be careful with less-liquid options and stick with the popular, highly liquid stocks such as APPL, GOOG, PCLN etc.  Either that or use a larger stop loss.

One last thing - if you get stopped out, stand up and high-five yourself because you followed your plan.  If you take profits, don't celebrate since (thank you John Carter) "Euphoria is the worst kind of stupid."

The Closing Continuation

This trade is done in the last 30 minutes of the day.  Set your charts to daily time frame and look for a stock which has had a big day to the upside, preferably into new high territory.  In my case this week I picked  CELG- Celgene which had a huge week along with a number of other large biotechs, BIIB, CELG, AMGN and REGN.

Anyway, check out the price action on this big green bar in the middle of the chart.  This was on Wednesday when the SP-500 had a huge day and CELG had about a 5 point move from about $116 up to about $120 and closed the day at $120.90.

In this case, I chose the CELG April 120 calls at a limit of $2.  In one account, I fat fingered the order and paid the market price of $2.10.  In the other account, I entered it properly and was filled at a limit of $2 even and held them into the close.

For this trade, we are looking for continuation of the prior days move, preferably with an opening gap in our favor.   Fortunately in this case I got it and was able to sell the contract for $3.10 on one account, and about $3.50 in the other account.  That's about a 50% gain in less than 24 hours and not bad for a day's work!

For a final example, take a look at the LNKD - Linked-in daily chart.  This stock had a huge day on Friday and closed at a new all-time high clearing the prior all-time high at $185.14.   I went into the weekend long the April 180 calls at $7.  I'm looking for a quick gap up on Monday morning and if all goes well, I will close the contracts for about $10.  Watch the open of LNKD on Monday and we'll see what happens!

That's all for now.  Enjoy your weekend, spend some time with your loved ones and get some rest.

Sunday, April 7, 2013

Meta-Trader - The Cost of College

Welcome back, Meta-Traders.

This past weekend I spent half my time on an overnight visit to the college where my son is likely to attend starting next fall.  So I didn't get to do my regular post about money and markets.

Recall in my prior post College Bound, I was shocked to find out that I could potentially have to shell out $200,000 over a 4-year period to send my first child to college.

Plus with the cost of college going up at about 8% per year, and since I have another child just entering High School, college could turn out to be a real deal-breaker financially.   Well I am reaching the end of my journey of discovery and getting ready to write my first check, so I figured I would share what I found out.   Most of this applies only if you live in the United States, so if you live elsewhere, your experience may vary.

First thing is that there is a huge difference between the cost of public and private colleges.  Most public schools in my state (New York) cost about $20,000 per year inclusive which includes tuition, food and lodging.   Comparable private colleges in the region cost between $45,000 and $55,000 dollars per year!  

Since I went to a private school myself I felt my child deserved the same advantages.  And I also heard that private schools really don't cost all that and you get some type of discount, right?   How much do private schools really cost?  Here's what I can tell you:

1) Some kids get what the call the "full ride" which includes 4 years of college completely paid for including room and board.  This is available to people who attend federally funded military academies such as the one located in West Point, NY (not far from where I live) and Annapolis Maryland.   Well my kid has no interest in the military, and I don't blame him so that option is out.

2) Other kids get the "full ride" if they are extremely talented with a highly desirable skill.  Musical or artistic  talent don't seem to count as much as sports.  If your child is talented enough to get a "full ride" based on their talents and abilities, congratulations!  No such luck for me.

3) On the private school side, discounts seem to fall into one of 2 categories:

3a)  This is students with with B+ to A- averages and 1000-1200 SAT scores and offers a "scholarship" of about 10K per year lowering the cost of private schools from 35K to 45K

3b)  This category is for students with A to A+ averages and SAT scores from 1200 and upwards and offers a "scholarship" of about 20K per year lowering private school cost to about 25K to 35K.

My child fell into category 3a bringing the cost of our first-choice private school to about 42.5K per year.

4) Next up is "need based" Financial Aid.  This is based on a formula developed by the US Government and takes into account your salary and all other financial assets including the cost of your home but not including  for your retirement funds.   Based on completing an on-line form at Fafsa.gov starting on January 1 of the year your child will first attend college, the form determines a single number called your "Expected Family Contribution".  Colleges determined your "need based" aid based on this formula

Amount of need =  Cost of Attendance - Expected-Family-Contribution

Well in my case, my Expected-Family-Contribution was 70K a year.  This is more than the cost of attendance, even before the discount.  So no need-based financial aid for me.

After that, all that's left is student loans.   Media reports indicate that student loan debt is the new debt crisis and now exceeds credit card debt!  And unlike most consumer debt, student loan debt cannot be discharged in bankruptcy.   On that basis, student loan debt is now burdening an entire generation of spenders and savers who can not afford to buy houses and all the required stuff and can have adverse financial consequences across the lifetime of the student.  In other words, the jobs available with that college degree don't justify the degree of indebtedness.

And the terms of student loans are not that favorable.  Students who have demonstrated financial need based  on the FAFSA formula get what they call "subsidized" loans.  These loans defer interest calculations while the student is college.  For the rest of us what's left are "unsubsidized" loans.  

A quick check of the terms for these loans were horrendous.  For example, they take 1% "service fee" off the top.  So if you borrow $20,000,  you own them $20,200 right off the top.  After that, the rates are above 7.5% per year and start accumulating interest as soon as you start borrowing.  My first instinct was - can I take other side of that trade?   In other words - can I loan you the $20,000, take a $200 bonus and collect 7.5% per year?

Fortunately, my son was admitted to a SUNY - State University of New York - college and it will cost me about $20, 000 out of pocket for the first year.  This may not be best in all cases for example if your child is highly talented and knows exactly what they want to study.  In my case, my son is unsure what he wants to study.   Many thanks to the great state of New York and to its motto "Excelsior" which means "ever upward" in Latin.

We are not ruling out a Master's Degree or other type of graduate school once he figures out what he wants to do.  What I have found is that is not where you start out, but where you end up in life that counts.

That's all for now, have a great week.