Saturday, October 26, 2013

Active-Trader - GOOG 13110C1000

Welcome back, Active Traders.

I have kind of a love-hate relationship with Google.  As for the Love part, you have to love a company created from nothing less than 15 years ago by a pair of college Computer Science majors.  Now the company has the 3rd largest capitalization of any company on the US market.  The other part of the love is that Google hosts the blogger platform that makes this blog possible - and I have never paid them a nickel to use it.

As for the Hate part, you have to resent a company this powerful. Note that Google keeps a record of everything you have ever searched for by source IP address.  Think about everything you have ever searched for through Google and think about how much Google knows about you as a result.  For that reason alone, I have started to use bing.com for all my web searches. Bing is hosted by Microsoft - But Its Not Google.

The other part of the Hate relationship is that I went for a job interview with Google in New York City. After weeks of preparation, they basically laughed me out the front door.  That's right - I am not nearly smart enough to work at Google.  Well maybe it wasn't quite that bad, but it felt that way.

Another thing about Google is that it has been notoriously hard to trade.  Recall in last week's post, I went into the weekend long the 995 call at about 21.  At the time, the stock was about 1011, and I was expecting a gap up to the 1020 area on the open.  That would yield a quick $900 profit which I was eager to collect in my TradeStation account which has been struggling to get out to a new equity high.

Early in the pre-market on Monday, the stock was trading at about 1020 and I already licking my chops at the easy profit I would collect.  There's nothing like a $900 profit to get your day off to a good start.  I was watching right at about 9:30 and was disappointed to see the stock open in the 1012-1013 area.  I had about a $100 profit on the contract and I know from opening gap plays how fast the stock can reverse after the gap.  So I put a stop loss in at least to lock in the $100 profit and waited for a fill.  The stock dropped though my stop but no fill.  I sat there for a minute or so and waited, reminiscent of my prior post The Gap, Freeze and Slip.  About a minute later, my fill came through - filled for a loss of $45!

How could what should have been a $900 profit turn into a $45 loss?  The options market has many way of separating you from your money and I could only conclude that events have conspired against me.  But I got my just deserts later in the week and here's where the story gets fun.

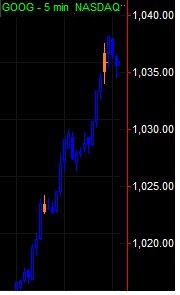
I was watching Google on Wednesday and the stock was strong.  It had traded down to the 1000 area and bounced strong and was headed for an all-time closing high.  I was about 1:25 PM EST and the stock cleared the 1017 area.  So I picked up the next Friday GOOG 1000 call for about $24 giving the stock a fair value of $1024.  After a brief rest, the stock moved higher.  I was surprised to see it clear 1020 a short time later and I was up a few hundred.  This time I sat back and gave it some room to breath and sat through a brief pullback in the mid $1020's.

I continued to ignore the stock and was surprised to see it break the 1030 zone not too much later.  Now here is was less than 2 hours after entry, and I as up nearly $1000!   So I put in a limit order to sell at $34 and was filled instantly.   I had my revenge, I bagged $1000 on Google options in less than 2 hours time!  Total commission paid on the trade $2.  TradeStaion worked like a champ on this trade - total commissions paid on this trade $2!

So that trade aside, I have been struggling in my TradeStation account.  I haven't seemed to find my edge. On the plus side, the account has been positive from the beginning and hasn't gone into an equity draw down from its opening value - not even once.  At one point I was up 10% - peanuts by John Carter standards - but not bad for me.

I came to the conclusion last week that I need to pick my trade entries much more carefully and wait for well-defined setups on the daily chart before taking action.  More to come on that.

Enjoy your weekend and have a great week ahead.

Saturday, October 19, 2013

Active Trader - More Equity Highs

Welcome back Active Traders.

It was another spectacular week in world equity markets with the SP-500 and Russell 2000 indices making new all-time highs.  Meanwhile the Nasdaq 100 made it out to a 13-year high and has now retraced about 75% of its huge 80% decline between the high in March of 2000 to the low of December 2002 in the bursting of the tech bubble. 

All this bullishness sent my net worth out to new all-time highs for the 4th separate time this year.  My favorite social media stock Facebook, had a spectacular week tacking on 10.4% to a new all-time high.  As we can see from the chart on the left, the stock has not yet made it to the 161.8% extension of the recent high to low swing.  I expect much higher prices ahead and earnings are not due until 10/30/2013 after the close.

And speaking of spectacular, Google announced blowout earnings on Thursday afternoon, and the stock went parabolic, closing the regular session at 888 then sharply higher in the after hours session.  By the end of the day Friday, Google closed at 1011.41, up a spectacular 123 points or 13.5% for the day!

This caused a feeding frenzy for all things tech and ignited a huge broad market rally on Friday.  I did not participate in Google, but went out long the GOOG next Friday 995 call expecting a gap up on Monday.  Many investors would never consider taking a long position after such a big up move,. But experience has shown that moves like this typically lead to continuation and I expect to flip out the call for a nice gain into a gap up on Monday.  The stock traded as high as 1015 in the after hours on Friday so that trade is looking good so far.

Part of this week's rally was due to a deal in Washington that ended a 13-day government shutdown and extended the debt limit until mid-February.  The country also came dangerously close to a default on its debt which led to much concern around the globe including a pair of editorials in China newspapers scolding the US for being so irresponsible with the threat of default of debt payments.  The newspapers also called for a de-Americanized world economy less reliant on the US dollar as the world's default currency.

Students of American history will recall that politics in the US has always been a bitter partisan struggle. From the battle between States Rights versus Federalists to North versus South, Republican versus Democrat,  Red States versus Blue States, American politics have always danced on what seems like a razor edge between opposite interests.  It all came to a head in the election of 2000 when the race between George W Bush and Al Gore was so close it came down to the decision of one state - the state of Florida.   The declared loser Al Gore challenged the outcome in the Florida Supreme court.  After an agonizing 6 weeks of uncertainty, the impasse was ended when the US Supreme Court trumped the authority of the State of Florida Supreme Court and declared George Bush the winner.

The point is the US system is designed to resolve these issues in favor of the majority - no matter now narrow it is.  The winner-take-all nature of the presidential electoral system is designed to enforce unity by making the outcome of elections seem much more decisive than would occur if it came down to a populate vote.  And the 3-way power split between the House, Senate and the Executive branch almost forces 2 of the 3 powers to come down on one side or the other.  In this case, the Senate and the President (controlled the Democrats) came down on one side and the House of Representatives (controlled by the Republicans) came down on the other side.  Anyone with an elementary school education in US Politics could see that there was no way the Republicans could win.  They finally gave in with less than 12 hours to go before default.

Despite all the drama, the stock market just seemed to shrug it off and even rallied in anticipation of a deal before it was even announced.  So for all you out there that think America politics is a mess, you are right.  But get used to it, because this is how it works.

Meanwhile, I continue to be impressed by the ThinkorSwim platform.  The Calendar feature on the Marketwatch tab gives a quick graphical overview of key events by day of the week and time of day.  Events are color coded by Dividends (Green), Earnings (Blue), Conference Calls (Red), Stock Splits, (Purple), and Economic Events (Violet).  Click on an item to get details of the event.  Check and uncheck the boxes on the left side to show or hide various combinations to meet your needs.

The Heat Map feature on the Marketwatch tab gives a box-based graphical representation of what is moving in the market.  The universe of represented stocks can be modified between index compoents such as all members of the Dow-30 or your own personal portfolio or watch lists.  Boxes are grouped by sector (such as energy or Information Technology).  The size and color of the box indicates the magntitute of movement up or down.  Looking at this graphic, which 2 stocks moved the most on Friday?

Finally, the Chart tab has a number of cool features that side in from the right or from below.  This view shows the Level 2 screen which shows the depth of bids on the left and offers on the right.  This gives you an easy visual representation of whether there is more demand (bids) or supply (offers) for the stock.  Check out this screen shot of the Level 2 screen for Facebook and tell me whether there are more bids (left) or offers (right).

Funding for my Thinkorswim account is in progress and I proceed once I start to get the proceeds of my Forex Accounts.

That's all for now, have a great week ahead.

Sunday, October 13, 2013

Active-Trader - The 1.272 and the 1.618

Welcome Back,  Active Traders and Wealth Builders.

This past week we finally got the nasty correction in the stock market that I predicted back on my poetic post Evidence of Autumn back on August 11, 2013.

This is not much of a stretch of course, given all the evidence.  Its amazing since one would think the odds of a market sell-off would be distributed evenly throughout the days and months of the year.  But its not the case since, for whatever reason, the stock market always finds a reason to sell off hard in the month of October.

One thing I have learned from the my time in the Simpler Options trading room is the importance of Fibonacci time and price relationships.  The chart in the upper left shows a chart of Facebook made with TOS using the Fibonacci Price Retracement tool.   The chart shows the high at $51.60 and the subsequent low formed 8 days later at about $45.40.   A few points to consider:
  • The entire move from top to bottom constitutes 100% of the original pullback
  • The green lines represent 50% and 61.8% of the original move which is a normal retracement of a move in the primary direction.  I bought FB near the high of the low bar and expected a move back to 61.8% of the move to take profits.  I took profits too early, but that's the subject of a different blog post.
  • The Cyan (light blue) lines represent 78.6 and  100% of the original move
  • The purple lines represent 127.5% and 161.8% of the pullback and represent targets or points of future resistance should the price break the old high to the upside.
Like support and resistance, Fibonacci levels represent likely levels of resistance after a move occurs. They are not hard and fast levels, rather price points to be aware of after well defined moves from top to bottom.

So put on your Fib glasses people and be aware of these price relationships on daily and larger levels since they let you know when to take profits.

That's all, have a great week ahead.

Sunday, October 6, 2013

Active-Trader - Welcome Thinkorswim

Welcome back Active Traders and Wealth Builders.

Between E-Trade and TradeStation and TeleChart 2000, the last thing I need is another broker and charting/trading platform.

But based on input from my friends over at Simpler Options, I'm starting to see the benefits of Thinkorswim  abbreviated TOS.  TOS traces its roots to Telescan founded in Texas back in 1983.  In 2009 Thinkorswim was acquired by brokerage giant TD Ameritrade which is itself a subsidiary of Toronto Dominion, the Canadian Bank.  The TOS faithful were pleased to find out that TD would hold onto the TOS team and platform and brokerage, run it alongside their less advanced web-based platform.

There is so much to this platform, its going to take some time to get fully immersed.  The screen on the right
appears as a pop-up over the main screen and itself contains a wealth of information.  On the left a live stream of CNBC during market hours.  On the right a series of clocks showing time in Chicago, London and Toyko.  Underneath are a series of upcoming economic or earnings developments with the time of day expected.

The central portion of the screen shows news of interest, and in this case release notes on the latest release of the platform - just released yesterday as a matter of fact.

Pit Noise

On the left side (not shown since the market is closed) are a series of chat rooms and audio/video streams. The most popular room by number of attendees contains a live broadcast from the S&P 500 Pit at the Chicago Mercantile Exchange. Click on this link and you will see a live TOS screen showing S&P, Nasdaq and Russell Futures.  But the really cool part is the audio commentary.   What you hear is something that alternates between a carnival barker and auctioneer, with occasional breaks back to normal speaking to point out Daily Pivots, Highs or Lows for the day and commentary on the pit action.

One very interesting thing is that the commentator has 2 distinct audio modes.  One is a low monotone and somewhat hypnotic which delivers the current bid and offer.  Then he breaks the monotone to point out new highs or lows or interesting action in other futures markets includes Gold, US Dollar and Oil.  And then he goes right back to into the hypnotic monotone on calling the price action.


I have often read that pit traders have a hard time making the transition from Pit Trading to Screen Trading and now I understand why.  The Pit commentary gives you an entire wealth of information, at a very sensory level that you can't get from a TV or a chart.  Some examples:

The level of activity and excitement based on the level of animation of the speaker
- Comments on activity of the major players and whether they are "at the bid" (buying) or at the offer (selling).
- The players fall into one of 2 major categories:

Paper - These are the traders who represent the major institutional players
Local - These are the local traders who make a living making a market in the pits

By listening to this flow, you can easily whether anything of interesting is going on, and on which side of the market are the major players leaning.

Based on the type of trading I do, this information doesn't make a whole lot of difference, but I think its very interesting to get the underlying tone of the markets from the place where the big players make a market.

On the financial side, the commissions are not as good as TradeStation.  Based on the association with Simpler Options, I can get a $1.50 per option rate versus $1 per option from TradeStation.  But I also get an array of Futures Markets that I don't get from TradeStation without buying a data package.   The futures data alone makes the platform very handy for checking market action after hours.

One example in Sunday evening at about 8 PM EST when the 24-hour Live futures markets trade.  I recall during some fateful times during the financial crisie of 2008/2009 when John Carter came in and traded the futures Markets to take advantage of huge moves when most traders were still drinking beer and enjoying Sunday Night Football.

So we add TOS to our large arsenal of trading tools.   Have a great week all.