Friday, May 27, 2011

Meta-Trader - Memorial Day 2011

Welcome back Meta-Traders.

Summer has arrived here in North America and after a long and nasty winter and a wet spring, I say bring it on!

Its a good time to pause to remember all those who came before us who have sacrificed to allow us to share the peace and prosperity we have today.

As for the markets, it was a rocky month for trend followers with major, multi-month trends in Gold, Silver and the USD coming up against some nasty reversals in the month of May. On the equity side, major indices, SPY, and DIA completed their 4th straight week of declines and a modest rally in the past few days didn't help much to reverse the weekly trend. But we had some good action in Equities and Forex, so let's get to that.

As for equities, I went into the week with a high cash position. Monday there was red all over the board which is typical for the Monday after an Options Expiration. AAPL came back to support at the $330 area so I picked up some for a move back to the $335-340 area - a repeat of last week's trade. The bottom formed just as I expected, and AAPL rallied back and I sold the shares later in the day for about a 3 point profit.

On Tuesday, I noticed that Netflix (NFLX) was coming up against its old high at $250. I smelled a breakout and even tweeted it at http://twitter.com/tcxmon, so I picked up some in the $251 area. I was a little dissappointed to see it close the day at $247.60. On Wednesday, it came roaring back and closed the day up 9 points to about $259! Thursday it roared higher and I closed the position at about $262, up about 11 points in a mere 2 day period!

In retrospect, I probably closed the position too early since it closed the week at $264.50. But I saw a similar opportunity in AMZN and went into the weekend loaded up on the long side. This is a longer-term story and I think Amazon has the look of a winning stock. Give it some time.

As for Forex, it was a spectacular week with nearly every system showing solid gains. Let's do the numbers.

Atinalla No3 picked up about 2% for the week and is up 28.59% for the year.

Not far behind is Atipaq Full Portfolio which picked up about 2% on the week to a new equity high up over 42% year to date.

Next up was Megadroid Live which picked up about 1.2% on a pair of profitable trades.

Next up was FX-Regression which picked up 4% for the week. This system has been on an unholy tear and picked up 15% for the month. This chart of USD/CAD tells the story - sloppy-sideways action that is perfect for FX-Regression. Just a reminder - FX-Regression is free for download to members of my Yahoo Group at FX-Mon. Just request a membership and i'll sign you up.

Next up is Atinalla FE which picked up about 1 half percent on the week.

Closing out the live accounts, Atinalla No3 and Atinalla No4 were also up, but in unspectacular fashion.

Finally, Coatl EUR Centered Portfolio peeled off about 3% for the week - which was not unexpected given its incredible run up to now.

Over at Asirikuy, Daniel continues to churn out new systems faster than I can review them. Next up on the Asirikuy review series is Amachay which as I understand is a counter-trend system. Check back later for that and enjoy your holiday weekend.

Sunday, May 22, 2011

Meta-Trader - Coatl Review - Part 3

Welcome back Meta-Traders.

Here is part 3 of my review of the COATL trading system. If you haven’t already, go back and read Part 1 and Part 2 before tackling part 3.

One thing to appreciate about Coatl is that it is very flexible trading system. To call it a system at all is a major oversimplification given its vast (2.41*10^16) decision space. Daniel addresses this by calling it a “framework” out of which profitable systems are derived. As we will see shortly, there are many clever ways in which it can be implemented in a portfolio fashion.

Before we get to the portfolios, take a look at the user interface. All of Daniels’s EA’s sport an attractive user interface and Coat is no exception. It shows the ATR value, profit earned up until now, the underlying logic being used by the 3 embedded systems, and “Internal Closing Threshold” or take profit/stop loss in pips. Looking at the screen, it’s easy to see the underlying logic and pip values for exit used by each of the 3 embedded systems for a given pair.

One interesting way that Coatl is deployed is in “currency centered” portfolios. My favorite is the “Euro-Centered” portfolio which trades EUR against USD, GBP, CAD, JPY, CHF, AUD and NZD. Each pair has a recommended set of custom parameters which saves you the time of performing a 5-hour optimization for each pair, followed by the non-trivial task of picking the best parameters to trade. Each pair also has a recommended risk value per trade when traded in a portfolio based on back-testing and analysis in Daniel’s portfolio analyzer program.

An important point is that these portfolios were back-tested on 9 years of historical data (2000-2009) then tested on "out of sample" data for 2010 and beyond. This avoids the pitfall of hindsight and optimization in system design.

As you can see on the right, I’ve been trading the EUR centered portfolio in a demo account for less than 3 months and its up nearly 50% in that time. I inadvertently omitted EUR/NZD from the portfolio. These are pretty impressive results to be sure. But with risk comes reward, and we need to understand the worst case scenario before trading it live.

To understand the risk, let’s examine how the system trades. Each of the 3 embedded sub-systems will open only one trade at a time. Once opened, a trade remains open indefinitely until either:
  • The system closing condition occurs or
  • The “Internal closing threshold” is hit which is essentially a take-profit or stop loss, always less than 300% of the ATR. These values take affect at the close of the current candle - in this case once a day since we are trading on the daily chart.
  • The Emergency Stop Loss occurs which is 600% of the ATR. These values take affect intra-candle.
The Internal Closing threshold is optimized, and in the case of EUR/USD, its 225% of the ATR. Using the above screen shot - we see the ATR is 142 pips. That means the stop-loss in pips in this case is 319 pips (142 * 2.25) for one of the 3 positions. Given the recommended position size settings of less than 1% each on a $2000 account, positions range between 0.01 and 0.02 per . That is 10 cents a pip meaning a stop loss on one trade would come to nearly $32 or about 1.6% of the account. Multiply that times 3 positions and the max stop loss for 1 pair is $96. Multiply that times 7 (for 7 pairs) and you can see that comes to $672 or 33% of the account! That's the normal stops loss case.

In an emergency stop loss case, it would be 2.6 times that or 85%, effectively wiping the account. Now before you dismiss this system as too risky, consider the fact that not all 3 positions have to be in the same direction. For example, for the EUR/GPB pair, 2 of the 3 systems are long EUR/GBP, and one is short. That means this system is not NFA compliant, so for US-based traders, you need to use FXDD which has a back-office solution to address this situation.

Also, consider the fact that not all pairs are likely to move in the same direction at the same time. The EUR portfolio is a bit of an exception since EUR comes first every pair, so a strengthening EUR means a rising pair in nearly all cases. In fact if you look back at the performance of the Coatl EUR-Centered portfolio, it corresponds very strongly with the performance of EUR/USD itself, peaking about 3 weeks ago, and going into drawdown ever since. For other pairs and portfolios, that might not be the case. Consider a portfolio containing AUD/USD and USD/CHF. Since USD is on different sides of the pair, it’s more likely that these pairs would move in opposite directions.

It is important to note, however that this portfolio (and other Coatl portfolios) have a higher worst-case number -48% in this case. That means that if the portfolio lost 48% of its equity, we would stop trading it. This is a higher value that for most other portfolios on Asirikuy. But we get more potential return as a result as we will see below.

And on the topic of portfolios, Asirikuy has portfolios for USD-centered, JPY-centered, CHF-centered portfolios. The table below shows all the different pairs traded in those systems.

When you consider that each pair takes a 5-hour optimization run, followed by wading through the 18-sided hypercube to pick parameters, it’s clear how much work as gone into construction of these portfolios.

Also, the JPY-centered portfolio trades GBP/JPY which was an old favorite of the Zulu-Traders due to its high level of volatility. A 200-pip move in GBP/JPY was pretty common, and I recall seeing days of 500-pips or more movement on a big day.

And as if all that weren’t enough, there are also Coatl portfolios that run against the 1-hour and 4-hour charts. These portfolios stick mainly with the major pairs.

There’s also a “20-year” portfolio that trades the daily charts for the handful of major pairs for which there is 20-years or more of history. The standout thing about this portfolio is that it was optimized with historical data from 1990-2000, then tested out of sample on 2000-2010. Prior to 1999, the EUR was tested using DEM.

So as you can see, there is no shortage of ways to deploy Coatl in a portfolio setting. And as you know I’m always interested in performance. So how have these portfolios performed since they went live earlier this year?

Well I can’t share the exact performance numbers, but I can say that every portfolio is up and many of them are up better than 10%. Every portfolio also has between 10 and 20 trades open, and in some cases the open draw downs are equal to 30%-50% of the closed profits. So this system opens a lot of trades, and keeps them open for days, weeks or months. So be sure you are comfortable with that before going live with this system.

Returning to my favorite - the EUR-centered portfolio - it’s interesting to see that the live account on Asirikuy hasn’t done anywhere near as well as my own demo account. Strange since it was opened just a few days after my demo account was started.

Finally, 3 month’s demo trading history is not much to go on. So let’s wrap up with an analysis of the EUR-centered portfolio on 9-years of back-test history using Asirikuy’s profit and drawdown analyzer tool. Here are the highlights:
  • 100K grew to 14 Million dollars!
  • The “Arithmetic Mean Gain” was nearly 60% per year
  • Maximum Drawdown was just over 21%
  • The maximum drawdown period was just about 6 months which is about half as long as some of the other systems on Asirikuy
  • On a monthly basis, the system was profitable about 60% of the time with average profit clearly exceeding the average loss.
  • The largest losing month was just over 14% while the largest winning month was just over 22%
  • System was profitable in every one of the last 10 years - with 2010 being the biggest winning year. Interesting that it was optimized with 2000-2009 and 2010 was the best year, up over 110% for the year! The best year prior that was 2003 which was up about 93%
Based on these numbers, this is clearly one of the most impressive portfolios on Asirikuy. But keep in mind the higher worst case scenario and remember to use risk capital only.

To summarize, Coatl is one of the impressive accomplishments to date on Asirikuy. Nothing is guaranteed in life, let alone in the world of forex trading. But I’m confident that if you pick a portfolio, start with an adequate amount of risk capital (at least $2000 USD), follow all the recommendations, and take a long-term perspective, there’s an excellent chance you will make some good returns trading these portfolios.

Friday, May 20, 2011

Meta-Trader - End of the World

Welcome back, Meta-Traders.

It was a sloppy week full of twists and turns, but not a lot of new information. Last weekend's arrest of the IMF Director on sexual assault charges provided much fodder for the media and Facebook. A downgrade of Greece by rating Agency Fitch continued worries in the Euro zone.

On this side of the pond, the unresolved issue of the United States debt ceiling weighted as the US Treasury is now out of money and being kept alive by accounting tricks by Treasury Secretary Timothy Geitner. Meanwhile, men behaving badly - DSK and Arnold - got all the headlines, while Geitner's press release citing "Catastrophic Economic Consequences" barely got any coverage at all.

As for equities, the IPO of Linked-in, (LNKD on the Nasdaq) on was a bit of a milestone, rocketing from and offering price of $45 to close at $94.25 on the day, up +109% from the offering price. Not bad and could prime the pump for further offering from Facebook, Twitter, Groupon, etc, etc. Good to see capitalism alive and well.

Also for equities, I had a good swing trade in AAPL and pulled out about 7 points in a 2-day period and went into the weekend flat. I started a new position in fast food company Yum brands (YUM) on a breakout to a new all-time high. Some short call options in HMSY expired worthless (which is good) and I wrote some more Sept 80 calls for a fat premium. That aside, I continue to be underweight in equities and happy with that position as equities seem to be moving sideways-down for the time being.

As for the Forex robots, the star of the week was Atipaq Full Portfolio which gained nearly 5% for the week and is now up a stunning 40.16% on the year.

Not far behind on the performance side was Atinalla #1 Live which gave back just under 1% on the week, but went out short EUR/USD with some open profits.

Megadroid Live picked up just under 1% on the week. I closed out last week's short in USD/CAD for about 55 pips profit. I went short USD/CAD again (accidentally in my FX-Regression account) into next week with a stop of about 0.9850.

FX-Regression had a solid week, picking up about 3% and profiting from all this sloppiness. Also, note the deposit of the broker bonus which will goose the performance of this account between 6-7% for the year.

The rest of the accounts were basically flat except for COATL EUR Centered Portfolio which peeled off about -3.5% on the week and went out with about -6.5% in open losses.

That's all for now, check back (hopefully) tomorrow for part 3 of my review of COATL. Enjoy your Saturday.

Sunday, May 15, 2011

Meta-Trader - Coatl Review - Part 2

Welcome back Meta-Traders.

Here is part 2 of my review of Coatl from Asirikuy. This review won’t make a lot of sense unless you read part 1, so if you need a refresher, go back and read part 1 here.

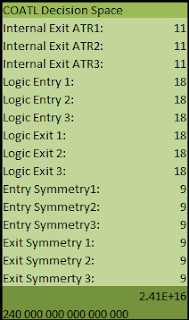
When we left off on part 1, we had a broad sense of what types of values were being optimized, but were only starting to wrap our heads around the size of the decision space. The spreadsheet on the left shows each if the items optimized by COATL and how many choices are considered for each item.

Broadly, here are the items optimized:

- Stop Loss values as a percent of the ATR (choose 1 of 11)
- Logic used for system entry (choose 1 of 18)
- Logic used for system exit (choose 1 of 18)
- Symmetry values for indicator levels for position entry (choose 1 of 9)
- Symmetry values for indicator levels for position exit (choose 1 of 9)

Daniel cuts down considerably on the size of decision space by using “symmetry” values for indicator levels. Symmetry values range between 50 and 90 and for upside crossovers constitute a cross of the actual value (say 80) and for downside crossovers are 100 minus the values, for example 100 minus 80 or 20. This clever use allows both upside and downside values to be optimized in one pass. It also ensures that indicator interpretations are symmetrical, hence the name.

Anyway, when we multiply the number of choices for all the items together, we end up with a decision space of 2.41E * 10^16. Written out in long form, that is 240,000,000,000,000,000 or 240 quadrillion possible combinations. When dealing with numbers that big, you can easily see why scientific notation is required. We don’t see numbers that big in the grocery store (or our bank accounts) but we see them in science and engineering.

To get a sense of what a difference the genetic algorithm makes, I started an optimization without the genetic algorithm box checked, and the system estimated it would take about approximately 795,000 hours. With 24 hours in a day, that comes to 33,125 days and with 365 days in a year, that’s about 90 years! Thus, without the genetic algorithm, it would take a lifetime to optimize just 1 pair! When the genetic algorithm box is checked, the optimization time is reduced to just over 5 hours!

Once you put in the 5 hours optimizing, all the work is done, right? Wrong, now you have 1000’s of optimization results to wade through to find the best choice. If you think this is easy, think again. What you end up with is a “Sparse matrix in Euclidian Space”.

Humans are pretty good at visualizing 2 and 3 dimensional spaces. Once you get beyond 3 dimensions what you get is a “hyper-cube” or a cube with N dimensions. In this particular case, you have a hyper-cube with 15-dimensions.

Meta-Trader helps you handle this challenge in a few different ways:

- MT4 discards the unprofitable results and only keeps the ones that turned a profit. With the 2.4*10^16 choices, the system came up with about 6,000 profitable combinations when optimizing on EUR/USD.

- MT4 shows a running graph of profitable outcomes with instances on the X-Axis and Profit returned on the Y-Axis. Neighboring results are usually nearby in Euclidean space on at least one dimension.

- In the same space as the graph, you can also show a 2-dimensional surface map which shows profitability as a shade of green at the intersection of 2 axis values. The deeper the shade of green, the more profitable.

Using that last feature, you can get an idea of what parameters values are producing profitable systems at the intersection of 2 sides of the hyper-cube. Obviously, you want to find a set of parameter values that are within a broad area of profitability that won’t fall into an area of unprofitability with a small shift it the market.

Overall, trying to interpret this data is one of the most interesting challenges I have come across in the amazing field of Forex trading. Also, I have to think this is one area where Meta-Trader comes up a bit short. I have screen shots from Wealth-Lab where you can fly through a 3-dimensional representations of optimization results. Even so, Meta-Trader is a pretty amazing tool, especially considering the fact that it’s totally free!

Hard as this challenge is, Daniel makes it easier by coming up with a set of parameter that he thinks perform best for each pair. In the case of EUR/USD, all 3 embedded systems use normal MACD crossover for entry, and a combination of long and short-term RSI crossovers for exit. And while on the topic of EUR/USD, let’s take a look at the performance of Daniel’s selected parameters for EUR/USD versus the other systems on Asirikuy. Why EUR/USD? Because it’s the most liquid, has the narrowest spread, and is a good basis for comparison with other systems on Asirikuy.

For a 10-year back test, and 100K invested and a risk unit of 1.0 per trade, 100K grew to about 415K. This comes to about a 13.82% return, but maximum drawdown is nearly 60% - clearly not among the best systems on Asirikuy for EUR/USD on a risk to reward basis. Clearly the risk would have to be dialed down and combined with other pairs and systems to get a more tradable result.

And that’s where the system really starts to shine - on a portfolio basis. There’s a lot to talk about there, so check back next week for the last and final part of my review of Coatl.

Saturday, May 14, 2011

Meta-Trader - Cracks in the Euro

Welcome back Meta-Traders.

We saw some cracks in the Euro-zone this past week with good economic reports from Germany and France early in the week highlighting the divergences in performance between the different member nations.

It seems ever more likely that weaker members Greece, Italy, Spain and Portugal will eventually pull out and go on their own rather that continue to be bailed out by the stronger members. This news saw EUR/USD drop from its recent high just shy of 1.50 down to just about 1.41 in just 2 weeks time.

Meanwhile, air continued to drain out of the commodity bubble with crude oil now down 15% to under $100 a barrel well off a recent high of $115. The rest of the commodity sector continued to deflate as well with broad commodities as represented by the GSCI (Goldman Sachs Commodity ETF) about 12% off its recent high. This confluence of factors has it starting to look like the long commodities, short USD trade is starting to unwind.

Equities continued under pressure which points out that rising equities in many cases are associated with rising commodity prices. With commodities cracking, equities are started to come off the recent yearly high set just 2 weeks back. Overall, I was well positioned this week with a relatively large cash position and out of tech giant AAPL which sold off back to the $340 area. That aside, it was stock-specific story with new positions in AMZN and QCOR (based on breakouts to new highs) and movie streamer Netflix (NFLX) threatening a new high, but not delivering quite yet.

Back to the currencies, choppy action lead to a mixed picture for our Forex robots with many systems taking losses on the week. But overall, results are good and I did a rough summary last weekend which showed i'm up about 10% overall on the year which beats the S&P 500 by a good 4 percentage points. Let's do the numbers.

Atinalla #1 had an excellent week and picked up nearly 3.5% for the week. It was short EUR/USD on all 5 trades and took profits on 4 out of 5. This system is now up a respectable 27.59% for the year.

Atipaq Full Portfolio lost about 3.5% for the week on a string of losing trades, 2 on either side of USD/CHF and a failed long in AUD/USD. Even so, its up over 35% for the year as is leading the pack among my live accounts.

Megadroid Live had a good week gaining about 1% on a manual trade where I shorted USD/CAD and took about 110 pip profit. I went into the weekend short USD/CAD once again and i'm looking to take profits in the 0.9615 area again this coming week.

FX-Regression did well in this choppy environment and picked up nearly 4% for the week. Overall, this account is still struggling around the 0% mark and like a close basketball game, I think this one's return for the year will be decided in the last few trading sessions of the year.

Atinalla FE peeled off about 4% on the week, giving some back after last week's breakout to a new equity high on the year.

Atinalla #3 was a disappointment and moved out to a new equity low for the year. This account is now down about -2.25% after having been as high as +12 earlier this year.

Atinalla #4 lost about -0.75% on the year and continues to struggle. I'm running a similar account over at Forex4Your Challenge that is doing much better, so its going to take some investigation to unravel that mystery.

Finally, COATL EUR-Centered Portfolio peeled off about -5% for the week and went into the weekend with about -8% in open losses. Interesting to see how this portfolio strongly mirrors the recently performance of the Euro overall.

On the development side, check back on Sunday for part 2 of my review on Coatl. Enjoy your weekend.


Sunday, May 8, 2011

Meta-Trader - Coatl Review - Part 1

Welcome back Meta-Traders.

In this review, we head-on tackle Coatl which is a word in Nahuatl which means snake. The snake imagery will make sense as you get to understand the system. Be advised that there is a lot to know and understand here and it will take more than one review to cover this system and associated portfolios.

The image on the left is depiction of Quetzacoatl which is a flying reptile deity of the Aztecs. Looking at some of the images of Quetzacoatl, I have to think the Aztec were using some pretty powerful mind-altering drugs!

Anyway this system is Asirikuy’s first-ever system derived using genetic programming technology. While I am a computer science major, I had a bit of a misconception that when using genetic technology –that you could start by telling the system almost nothing, and it would somehow come up with a profitable system through the magic of computer science.

It doesn’t work that way, of course, and you have to give the system a starting point as well as a set of rule boundaries within which the genetic algorithm will search for a profitable system. In the end, Genetic algorithms are just search or optimization technique where the computer searches a huge set of possible solutions and comes up with a winner among many, many alternatives considered.

Before we get into the specifics, let’s set some broad boundaries:

- Coatl is developed and tested against the daily charts.

This allows optimizations to be performed against non-major pairs such as EUR/JPY, EUR/CAD and opens up the field of trading to many more pairs and longer histories. It does run on H4 and H1 charts as well, but on a much smaller number of pairs.

- Coatl is developed and tested using Control Point Simulations

I did some research on the difference between Control Point and Every Tick simulations. In a nutshell, it comes down to the number of times the Start() function is called during back-testing of your experts. Every-tick simulations try to reproduce intra-bar results whereas Control point simulations make fewer calls per historical bar. For daily charts used here, the results for Control Point simulations exactly match the results of every tick simulations, except they run many times faster. This allows optimizations to run many, many times faster which allows for optimization of a MUCH larger space than could be performed using every tick simulations.

- Coatl does not optimize moving average length and other indicator parameter values.

Instead, Coatl does very broad and coarse optimization of trading methods when applied to a particular pair. And so far the results have been spectacular for the EUR portfolio as you can over on the right-hand side of this blog page.

The actual genetic programming comes from Meta-Trader itself – simply check the ‘Genetic Algorithm’ check box on the “Expert Properties” screen inside the Strategy Tester window. When this box is checked, Meta-Trader uses an embedded genetic algorithm to reduce the size of the search space.

In terms of the guts of the logic, Daniel uses his knowledge of indicators - and how they can be successfully applied to produce a winning trading system - to come up with a broad logic framework out of which will fall a successful system for a given pair and history. Some of the indicators used in Coatl - and baked into its core logic – RSI, Stochastics and MACD and others.

One of the indicators used is Daniel's own proprietary indicator which is at the heart of one of his best performing systems. If you are an Asirikuy member, you probably know what i'm talking about. If you're not, you'll have to join Asirikuy to find out what is is!

The inputs used for each indicator (period length for RSI for example) are pre-set in the system and not optimized - which was quite a surprise. As an example, the system uses a 20-period and a 40-period RSI, and there are 2 RSI related rules in the system. The rules are considered separately – the system can enter on a RSI upside crossover but exit using a completely different indicator such as MACD or Stochastics. The beauty of this approach is that you don’t have to bring any traditional interpretations of indicators to the table. Daniel provides the interpretations, throws them into the mix, and out pops a (hopefully) profitable trading system.

There’s a lot more to it and here’s where it starts to get interesting. For each possible rule being considered, there is a “Normal” and “Reverse” interpretation of the indicator. So the system can go long on an upside RSI crossover, or go short on an upside RSI crossover. For each system, there are a total of 18 possible indicator configurations which can be applied.

Taking a cue from Atinalla FE, Coatl allows for 3 embedded system per pair each of which has separate entry and exit rules. Also, the system uses a built-in exit as a percentage of ATR to exit positions independent of exit signals. That’s enough information to get a broad sense of the decision space:

- For a given pair choose 3 different systems.

- For each system, choose 1 of 18 different indicator configurations for position entry.

- For each system, choose 1 of 18 different indicator configurations for position exit

- The indicator configurations consist of regular (buy on upside crossover) and reverse (sell on upside crossover) conditions

- For some indicators such as RSI and Stochastics, the indicators are used twice, once with a short-term period (20 bars) and again with a long-term period (40 bars).

- ATR-based exits cover position stop-losses, but regular position exits are covered as per the system sell logic.

So what have is a alphabet soup of trading methods that all get thrown into a huge pot and shaken throughly until the winners pop out. To use a different metaphor, you start with an entire herd of potential trading systems. Gradually the herd is culled and pared down until the best 3 systems emerge from the mass of animal flesh. When you think about it, it sure beats the traditional method of developing systems which involves examining charts and indicators and then coming up with a winner after weeks or even months of trial and error.

How does all this result in a profitable trading system? Check back for part 2 to find out

Have a great week.

Friday, May 6, 2011

Meta-Trader - Green grass and blue skies

Welcome back Meta-Traders.

It was a spectacular week in North America and world markets. This week's photo tells the story, blue skies and green grass.

We started the week with news that the world's #1 wanted terrorist Osama Bin Laden was killed in a raid in Pakistan by US special forces. The death of another human is not a cause for celebration under any circumstances. But this event gave a much-needed psychological lift to the American people because it showed that we will pursue our enemies to the far reaches of the world which sends a powerful message.

As for the financial markets the commodity bubble burst this week with highlights as follows:
  • The Silver ETF SLV dropped a stunning 30% from its recent top
  • The Gold ETF GLD dropped a modest 4% for the week, tame compared to silver
  • The Oil ETF USO dropped 13% for the week
All this commodity deflation put a spring into the step of consumers and the economic recovery, which was being weighed down by rising energy prices. On top of all that, the non-farm payroll number came in higher than estimates and prior months numbers were adjusted upward showing good progress in the global economic recovery. All this good news sent the dollar bears into full-time retreat with the USD gaining nearly 6% against EUR for the week.

What did all the mean for our currency trading? It was a banner week with solid gains in nearly all systems. Let's do the numbers.

The screaming winner on the week was Atipaq Full Portfolio screamed higher gaining about 6% for the week and is now up about 38% year-to-date.

My personal favorite was Atinalla FE Live which went into the Non-Farm Payroll number short EUR/USD on all 3 embedded systems. Each position was modestly in profit until the NFP number came out and then wham! EUR/USD dropped about 150 pips in about 20 seconds Atinalla FE took profits on all 3 systems before it was even 8:31 AM EST! In a few seconds, Atinalla FE picked up 6% and is now up nearly 10% to a new equity high on the year. On top of that Atinalla FE shorted more EUR/USD later in the session and went into the weekend with about 1.2% in open profits.

Other gains in live accounts were good, but not as spectacular. Old favorite Atinalla No1 Live picked up about a half percent on the week, but went into the weekend with about 2.6% in open, unrealized gains.

Megadroid was quiet on the week, but I went in to the weekend short 1K of USD/CAD.

Atinalla No3 Live dropped to a new equity low intra-week, but came back to end the week up +0.82% for the year. Better yet, it went into the weekend with about 1.9% in open, unrealized profits.

Atinalla No4 SM which has been a thorn in my side all year lost about 1.2% on the week to a new equity low, but went into the weekend with nearly 2.5% in open, unrealized profits.

FX-Regression continues to struggle, but picked up 3% on the week and is now down nearly -4% on the year.

Last week's screaming winner on the demo side, COATL EUR Centered Portfolio crossed the up 50% mark which was a milestone for the best performance of any EA I've ever tracked in real time, real or demo. As it stands now, this account is up a stunning 56.8% for the year but went into the weekend with nearly 6% in open losses.

On the development side, I'm traveling this weekend and won't have much time for research. But my review of COATL (Part 1) is finished and ready to be posted. So check back in the afternoon on Sunday for that. As time goes by, I'm gaining a deeper appreciation for the hard work of our friend and benefactor Daniel Fernandez. Coatl itself is an amazing achievement in itself, and its taking some time (and more than one review) to fully wrap my head around it.

That's all for now. Go enjoy your weekend and check back on Sunday afternoon.