Daniel Fernandez once commented in one of his e-books that the psychology of Automated Forex Trading is one of the most difficult parts. There's nothing difficult about making money of course, in fact what could be easier? You just put up the robot and sit back and count the profits!
But what about when they lose money? Its not like we arrived at these systems haphazardly. After all, they are carefully selected from at least 10 years of back testing, with favorable risk/reward ratios, ATR based position sizing, robust coding techniques etc, etc. And these systems were back-tested, forward tested with demo money then forward tested with real money which was earned and saved by your humble blog author.
When systems fail, the questions start to arise such as:
- Are the systems working properly?
- Has the underlying structure of the market changed rendering the systems no longer effective?
- Are the forex brokers hunting my stop loss orders and since the market makers can see my stops, or put another way, is the forex market really fair?
- Is is even possible to trade the forex markets profitably using Automated Forex trading? Sure we have 10-year back tests that are profitable, and data provide by the industry, but do we have any actual live results we can point to?
And that's when FUD (Fear, Uncertainty and Doubt) start to creep in.
Fortunately, we have plenty of data to examine the behavior of our systems. We can compare the behavior of different instances of the same systems on different brokers. We can also compare the behavior of systems versus their historical performance such as maximum draw down, consecutive losses and win/loss ratios. Using those tools, let's see if we can come up with some answers to determine if we are just looking at a bad period of performance, or the entire Automated Forex Trading experiment is just low-hanging fruit for the market makers.
Fortunately, we have plenty of data to examine the behavior of our systems. We can compare the behavior of different instances of the same systems on different brokers. We can also compare the behavior of systems versus their historical performance such as maximum draw down, consecutive losses and win/loss ratios. Using those tools, let's see if we can come up with some answers to determine if we are just looking at a bad period of performance, or the entire Automated Forex Trading experiment is just low-hanging fruit for the market makers.
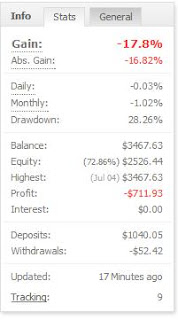
At the heart of my poor performance is the Atipaq USD/CHF instance which is embedded in 3 of my 4 live portfolios. The box in the upper left shows the year-to-date performance of this instance in my Atipaq Full Portfolio account. Atipaq USD/CHF is one of the best performing instances historically with a 16% average annual profit and a maximum drawdown of 22% on a 10-year basis. On a year to date basis, this instance is down 17% which is not even that bad compared to its 10-year historical maximum of 22%.
To be fair, Atipaq USD/CHF had a good year in 2011, with returns of about 17% with drawdown less than 10%. This lead the Atipaq Full Portfolio to an excellent year in 2011 and was up nearly 50% for the year. And at one point, the portfolio was up nearly 96% from the start before it crashed and gave back all those profits and just went negative this past week when considered from the start.
Now let's try to tackle the above questions one by one:
1) Are the systems working properly?
Yes, this is clearly the case since I'm seeing consistent trading between my different instances as well as the similar systems on Asirikuy. I'm not allowed to reveal specifics of the performance of systems on Asirikuy, but let's just say they are similar to what you see above.
2) Has the underlying structure of the market changed such rendering the systems no longer effective?
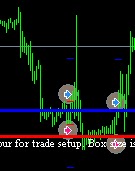
To examine this, we need to understand how Atipaq works. Basically, it builds a box based on the range of price behavior over the Asian session, or some number of hours before the active period for the pair. Then it basically buys or sells breakouts from the box with a TP being some multiple of the box size and the SL being the opposite side of the box. So the real question is, how often does price movement, after breaking one side of the box, return to the opposite side of the box before hitting the TP? It turns out the answer to this question is pretty much the win/loss ratio of the system.
 The table on the left shows the win/loss ratio for Atipaq USD/CHF for the past 10 years. Years 2002 through 2010 are based on back-testing and the figures for 2011 and 2012 are based on actual trading results.
From the 10-year backtest, the win/loss ratio averages about 50/50, meaning it wins about as often as is loses on a historical basis. For every dollar the system makes on winning trades, it loses about 60 cents on losing trades. That means the system has to win only about 40% of the time to earn a profit. And we can see that for most years, the system wins better than 40% of the time. The only exception was 2007 where the wining % came in just under 40%
For 2012, Atipaq USD/CHF is on the losing side on nearly 7 out of 10 trades. And since the win % is clearly under 40%, the system is losing money overall.
Anyway, what this table shows is that the Win/Loss ratio for Atipaq USD/CHF is lower now, on a year to date basis, than its been any time in the past 10 years.
3) Are the Forex Brokers hunting Stop Orders?
This one is pretty easy and is detected like this.
If the price has a single hourly candle averse move to briefly visit the price area, take out the stops then retrace back to the prior price area, the move is suspect. Also, there would be no other trades before or after the suspect price movement for a number of bars. Unless there is a news event, there's no other explanation and its easy to see on a chart. This particular spike may have been accompanied by a news event, since EUR/USD had a similar spike, but I can't be sure which one in retrospect.
Just how big is that hourly bar on the chart? The range of the bar is 125 pips, versus the 14-bar ATR of the daily chart which is 140 pips. Thus the range of that single bar represents 89% of the daily average true range of the pair!
When I started this blog post, I was suspicious that this type of price bar has caused me to lose money in GBP/USD trades lately. Upon closer examination (using with the "browser" feature of MyFxbook), I found that I actually profited on these price spikes, once on 8/2 in GBP/USD and again on 7/27. Also, I closed out a profitable long position in AUD/USD at the high price of that spike.
When I started this blog post, I was suspicious that this type of price bar has caused me to lose money in GBP/USD trades lately. Upon closer examination (using with the "browser" feature of MyFxbook), I found that I actually profited on these price spikes, once on 8/2 in GBP/USD and again on 7/27. Also, I closed out a profitable long position in AUD/USD at the high price of that spike.
Can anything be done to put an end to stop hunting? Well the systems can be modified to not submit stop orders and go with the broker default stop of 500 pips The Meta-Trader systems could execute the order when the price reaches the given Stop Loss level. This is higher risk, however since should our Meta-Trader platforms fail, we could be subject to an account-wiping adverse movement. Also, we would still be subject to these stop-hunting price excursions since the market makers are going after much larger players then ourselves anyway.
In this end, while stop hunting is a negative for Forex as an asset class, its just as likely that we would profit from a price spike as lose money.
4) Is it even possible to trade the Forex markets on a long term basis profitably using automated systems?
In the past Daniel has pointed to data provided by the industry which indicates that Forex trading is long-term profitable by either manual or automated trading. Its hard to trust data provided by the industry itself, and instead, I am inclined to trust data provided only by real, small investors such as myself. I suppose the jury is still out on this question, and time will tell.
Not to be all doom and gloom, I'm having a pretty good year in equities, and Fridays +1% moving in the emerging markets ETF's EEM and EFA ended the week on a good note.
Enjoy the rest of your weekend and the coming week.
Not to be all doom and gloom, I'm having a pretty good year in equities, and Fridays +1% moving in the emerging markets ETF's EEM and EFA ended the week on a good note.
Enjoy the rest of your weekend and the coming week.


Hi Chris,
ReplyDeleteI have been following your blog for a while, and I really enjoy it. Could you provide me with your email address, I have some ideas on automated trading which I would like to share with you, off the record.
Cheers,
Edward
Edward-
ReplyDeleteThanks for the comment. Please send me a private message via Twitter at https://twitter.com/tcxmon and I'll give you my e-mail. I'm happy to communicate, I just don't want put my e-mail address in so public a place.
Thanks, Chris
Hi Chris,
DeleteI can only send you a message on twitter if you are following me too: https://twitter.com/EdwardBernhardi
Cheers,
Edward
Thanks Edward, connection made. All the best and have a great week ..
ReplyDelete