Saturday, September 27, 2014

Active-Trader - Fib in GPRO

Welcome back Active-Traders.

Very few companies who have gone public in 2014 have had the spectacular performance of GoPro symbol GPRO.  The shares debuted at $28.65 back on 6/26/2014.  Today, a mere 90-plus days later, the stock closed the day at $82.10 which is an amazing 86% gain from the IPO price.

When and where will the move end?  Read on for my explanation of how fib analysis can answer these very relevant questions.

Recall that Fb levels are simply multiples of the magnitude of Elliot Wave 1 which is basically the move from a bottom to some top which resulted in the first meaningful pullback. Finding the bottom and the top of Elliot Wave 1 is the first and most important thing you need to know to calculate fiv levels.  Let's look at GPRO.

The chart on the left shows my first take at the Wave 1 move for GPRO. Note how the price found a bottom, rallied up, then fell back to the breakout point and found some support once again. This is typical of Wave 1 moves where the bottom is the lowest low on the chart and is not violated to to the downside.

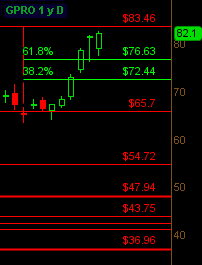
Once you know those numbers, you can project the 3 most important lines beyond wave 1 which are the 161.8%, 261.8% and 423.6% and the associated price levels.  We know the levels are correct when we observe how price reacts to those levels as it rises. Doing so we find that the 161% level at $66.70 was quickly violated to the upside then became an important level of support moving forward.

Since then the stock has been straight up and we find ourselves just a point or 2 below the top of the sequence, the line which represents 423.6% of Elliot Wave 1 move.  So there's our first price target - $83.46 which I expect we will reach not far into the trading day this coming Monday.  But is that it - the top of the top?   Let's look for another interpretation.

Instead of Wave 1 ending at 47.97 on 7/31/2014, lets assume it ends at 56.86 on 9/3/2014.  In this case, note how the 161% line also acted as an area of resistance instead of support as in the prior interpretation.  This adds some extra credence to this second interpretation and based on that we find the 261% line overhead at the $89.42 price level and the 423.6% line up at just under $122 price level.

All that said, I expect higher prices in GPRO with the first target at $83.46 and the second target at $89.42 which I expect we will see by the end of next week.  I went out long the 80-84 Call Debit Spread and some shares.

Have a great week ahead.

Saturday, September 20, 2014

Active-Traders - Swallowing BABA

Welcome back Active Traders and Wealth Builders.

In was an historic week for market watchers as we watched Alibaba trade publicly for the first time.  It was also a great time for the capital formation process as the market successfully digested almost 220 Billion of new market cap.

On your left is a graphic of all companies with Market Cap over 100 B.  If you add them up, it comes to about 2.8 T or 2,867 B.  With BABA's market cap of 220 B, it comes somewhere between FB and GOOG in terms of capitalization.   That represents an almost 7% increase in market cap that had to be absorbed.

All in all, it was a great week as follows:

- The BABA IPO worked as expected with no technical glitches

- SPY was able to make a new all-time closing high on Thursday before giving some back on Friday.

- US Fed came out and said they are going to keep rates low for a long, long time and that they can make up any new reasons they want for keeping rates low - in other words they don't have a fixed formula for when they would raise rates.

- The fact that China's largest Internet company  (who could presumably list on any stock exchange they wanted) came to the New York Stock Exchange and the US markets to list their shares is a tremendous vote of confidence for the US financial system.

All this said, the US Dollar is rallying strongly against most other currencies.  The US Economy seems to be rolling along, and the rest of globe wants to come along for the ride.

Have a great week ahead.

Wednesday, September 10, 2014

Active-Trader - PANW Fib Lines

Here is a quick look at fib targets for PANW. The first target is the 161.8% line at 102.88

This trade started out as a condor into earnings.  I sold the 82/84 95/97 condor on Tuesday for a credit of 0.72 and a max loss of 1.28.  The stock cooperated and held below the short strike at 95 in the pre-market Wednesday and tested it briefly during regular market hours then pulled back. Everything looked good for the stock to close the week out between 84 and 95 for a max profit.

At about 10 AM the stock started running and was soon at the 95 level and threatening to put my trade underwater.  It kept going and I scrambled to close the 95 short call at a limit of 2.6 for a net loss of 1.88 - greater than my original max loss, but I was still long the 97 call.   I ended up closing the long 97 call for a credit of 1.05 lowering my loss to a mere 0.11 not counting commissions.

Realizing I had a potential runner, I bought some stock in my other accounts as it crossed 96 in the 96.25 area.  The stock did nothing but run to the upside and nearly broke $100 before pulling back. I ended up closing the position out in the high 98's when it failed to break 100.  Overall I took just over 2 points out of PANW.  This was a classic case of an earnings trade gone bad, but turned out to be a winner anyway - another case of Lemons into Lemonaide.

I expect PANW to continue to the upside, but I'm not going to consider any new longs until it returns to the breakout point at 92.70.

Sunday, September 7, 2014

Active-Trader - Stairs up, Elevator Down

Welcome back, Active Traders and Wealth Builders.

One popular staying you hear about the markets is that stocks take the stairs up, but they take the elevator down.  Put simply, stocks sell off much faster than they go up.  How much faster you might ask?  Observe on this chart of AAPL that it took nearly 10 days for the stock to go from the 97 area to its highest closing high at about 103.  Also notice that the stock sold off hard from that level and gave back the entire 10-day advance in a single trading day.  How's that for fast?

Another example occurred this week in Gilead (GILD).  Note how the stock took 13 daily bars- almost 3 weeks of trading to go from the 99 level to its high at just about 110.  But the stock sold off the entire distance in just 2 short trading days!   Notice however that GILD had a much sharper reaction off the low and formed what we call a bottoming tail bar.  That means the stock sold down and quickly recovered that sell off within the same trading day.

I bring up these 2 examples because I got caught on the long side with both stocks.  After a long bull market you get lulled into a sense of complacency and don't consider putting in stop loss orders, particularly if these positions constitute less than 5% of your portfolio which is a reasonable maximum percentage allocation for a position in which you have an average degree of conviction.

So what can you do to avoid situations like this?

1) Put a stop below the low 2 bars back.

This strategy would have kept you on the long side of the moves in AAPL and GILD, but gotten you out before much of the damage was done.

2) Put a stop below the low of the high bar

I learned this strategy from John F Carter's excellent book Mastering the Trade.   This strategy would have gotten you out of both AAPL and GILD about halfway through the advances and is therefore more suited to those who actively trade full time.  They also would have gotten you out of the sell-off much sooner and with less of a loss assuming you were long going into the top.

As to when to re-enter, here a few rules of thumb:

1) Don't buy the first bar down after big sell off!  Many players do not watch the stock market during the day and only see the end of the day bar.  Once they see that, they panic and sell at the open the next day adding further to the slide.  Usually, but the 3rd day everyone who was going to sell into the panic has done so already and stock is ready to start to base.

So whenever you get a big sell off, whether its earnings related or not, wait for the 3rd day after the announcement for the stock to base before considering longs.  At this time, you usually get some reversion to the mean, for example fills of prior gaps, etc.

2) Buy when the stock breaks above the high of the low bar.  For GILD, that would be 106.6 and for AAPL it would be 100.9.

As for another angle, look for stocks which have been unfairly punished but the fundamentals are still good.  In the Energy space, we are seeing a 14-month low in the price of gasoline.  As scary as it sounds, I expect fossil fuel prices to double in the next 10 years. That means $8 per gallon gas which is what it costs in many other parts of the world already.  Get your shopping list ready and take your pick, COP, RIG, XLE, OIH.

Have a great trading week ahead.

Sunday, August 31, 2014

Active-Trader - All eyes on AAPL

Welcome back, Active Traders.

Last week's post AAPL New Highs 2014 marked a new all-time high in AAPL shares and was followed-up this past week by even more highs and the graphic on the left announcing a big product launch in early September.  Speculation is rampant that Apple will announce the iWatch or the long awaited iPhone 6 to challenge the competitor Samsung Galaxy s5.

First of all, you have to admire Apple's timing.  Not only are they waiting until the end of the summer vacation season, they are waiting until the first full week of September where everyone is back from vacation. Also, they are waiting for a Tuesday when everyone is recovered from the weekend and fully ready to start ramping up for the 4th quarter which is typically strongest for AAPL shares and the entire retail selling season.

As trend followers, its our job to pay attention to the obvious clues regarding price action, and it doesn't get much more obvious that we are expecting a run-up in AAPL shares ahead of this announcement.  How high to we expect APPL to go?  To get our answer, we turn to the voodoo lines as shown on the right.

Our first target is the upper snow line at 103.09 which is just a chip-shot from Friday's close at 102.5 and will likely open at or above that level by the open on Tuesday.  Beyond that, we have the 432% fire line above at $106.52.  That represents the upper-most fire line in the fib series and beyond that we have nothing more to rely upon technically except for round numbers (such as the $110 price level) and Fibonacci retracements of prior swing lows.

Based on that, I think its highly likely that we will see $106.5 before this move is over and it should be played with the weekly (expiring 9/12/2014) options to including action up to and including the announcement.

The $106.5 price level is a mere 4% higher that the current price level of the stock which is not much of a stretch for most stocks.  But keep in mind that AAPL is the single highest capitalized stock in the US market with a stunning 612 Billion in Market Cap.  That 4 point move represents 23.6 Billion in Market Cap which greater than the GDP of most African countries and is no small move. So expect AAPL to drag the entire market higher, but don't expect moves to be fast and furious.

As for how I am playing it, I am long the shares in both my regular and retirement E*Trade accounts and long the October Monthly calls in my Tradestation account.  The October 90 calls can be purchased for less than 50 cents premium above the price of the shares.  For example, you should be able to buy the October 90 calls for under $13 per contract.  That means you get a $102.5 dollar stock for $13 a share.  Don't load up the boat, but get long here for a run up into the announcement.  It doesn't get much more obvious that this traders.

Have a great week ahead and come back next weekend for the start of my new series on the TTM Squeeze indicator.

Saturday, August 23, 2014

AAPL - New All Time Highs 2014

Welcome back Active Traders.

This past week was a milestone for one of my favorite stocks AAPL - Apple Computer.  Recall we made some good money through 2011 and 2012 buying breakouts to new all time highs in AAPL.

Things continued in a similar fashion until AAPL topped out in September of 2012 and went into a long, steep correction that eventually erased 40% of the stock's value.  The general market as measured by the SP-500 also pulled back at about the same time, but bounced and recovered a mere 2 months later late in November of 2012.  AAPL instead continued to slide.

Things took a turn for the positive when the downside trendline was broken in May of 2013 and marked by my post AAPL Trendline Break. Recall this bottom corresponded with a number of shareholder friendly moves made by AAPL management which had been more or less ignoring the concerns of the shareholders.

Fast forward to August of 2014.  Since then AAPL has had a 7 for 1 stock split - another shareholder friendly move - and finally threatened the old all-time closing high at a split-adjusted 100.75.  I went long some AAPL shares on Tuesday 8/19/2014 in anticipation of a move to new all-time highs.  I followed up with the September monthly 90/110 Call Debit Spread.

I am expecting higher prices, but keep in mind that AAPL is the highest capitalization stock in the US Market at 602 B a full 30% higher than the next closest stock XOM - Exxon Mobil.  This means that it will move slowly and a 10% move up to 110 will not come quick or easy.   This means that AAPL stock will not make you rich at this point - if you are not rich already - but is still worth a long position in my mind.

As for stocks which will make you rich, I prefer earlier stage names such as GILD and TARO.

TARO is a particular favorite with a mere 6.6 B of Market Cap and other key features:

- 5 year earnings growth rate of 47%

- PE of 19.5

- Average Daily volume of only 76 K shares

Consider that in light of a new all-time high in the shares, and I continue to expect higher highs in TARO.

Have a great weekend and great week ahead.

Saturday, August 16, 2014

Active-Trader - Are you trading?

Welcome back, traders.

A funny thing happened to me this past week, I looked back and my recent behavior and realized, I was trading!  Now that sounds silly since I have been trading and investing for the better part of 30 years.  But this was different and here's how you know if you are trading or just on your way to becoming a trader:

5) Its Automatic

Your trading becomes a habit which almost exercises itself.  You don't have to think about it, its just happens by default.

One such trade happened with GILD this past week when in broke decidedly above the 261% fire line at $95.  I went long on the close in a classic case of John F Carter continuation.  The stock opened the next day at $98 and barely looked back.  I'm continuing to hold expecting a test of one of the 2 tree lines above.

4) You are trading setups and setups only

You don't take trades just because you thing something is going to happen.  For example, I was really convinced that GPRO was going to close below $40 and was tempted to sell the weekly 40 strike.  But other than that strong feeling, there was no setup.  GPRO did closed below 40, but it didn't matter.  I didn't take the trade and that's fine.

3) You are controlling your risk

Your positions have an automatic loss cut built into the trade structure.  This is easy to do with option spreads.

 I don't do a very good job with risk control on equities, so I guess I'm more of an investor than a trader in stocks so I fail the trader test there.

2) You are not emotionally invested in the outcome.

It doesn't matter whether you win or lose a particular trade.  There's always another trade and always another day.  As soon as you remove your emotions from the picture, the process and execution becomes more mechanical.

1) Your making money.

Have a great week ahead.