Saturday, August 11, 2012

Meta-Trader - The Gapdicator

Welcome back Meta-Traders.

Taking a look at the way the markets have been behaving lately, we see a higher than normal instance of price gaps.  Gaps occur when today's low is higher than yesterday's high or when today's high is lower than yesterday's lows.  Since we are seeing more gaps, I thought it would be interesting to know just how many more than normal?

To find out, brought up TC2000 and added the gapper's indicator which is shown on the chart to the left when applied to symbol EFA which is the iShares MCSI EAFE Emerging Markets Index fund.  I picked this one since it seems to have a higher degree of price gaps  The primary gaps indicator appears above and spikes back and forth between 0 and a max of about 1.92 due to a squashing function.   I then overlaid a 20-period moving average and came up with the Gapdicator - or Gap Indicator.

For the EFA, the indicator is nearly 0.5 which is quite high.  For the S&P 500 EFT SPY, its closer to 0.3.  For most typical stocks with little price gapping, its much lower.  Here's a quick summary:

EFA - Emerging Market's ETF - 0.48 - Relatively high but historical high as high as 60
AAPL - Apple Computer - 0.25 - Moderately high but lower than historical high at .45
SPY - S&P 500 ETF - 0.3 - Elevated and sustaining highs
Most stocks - 10-15 - With occasional moves up to 20

What does this mean for our trading?

  • Day traders miss out on the full extent of the gain because they don't harvest the gap on the long side
  • Market is thin due to summer vacations etc.  Its also worth pointing out that volume on the stock exchanges is reaching record lows.  Other than the high frequency traders, most of the public is hiding out in Mutual Funds, ETF's or bonds.   As a result it seems to be either risk-on, or risk-off depending on the latest news from the Euro Zone.
  • Results are terrible for Forex for breakout systems which is getting whipsawed back and forth.  Its so bad, I haven't even looked at the results for the week, i'll update it later.
As a result, I have become sort of disengaged from the Stock and Forex markets lately.  Also, I'm coming to crunch time on several projects with my regular job which are keeping me hopping.  So I haven't had much time for extracurricular development lately.

But its worth pointing out that stocks seem to have lifted the lid on the recent range and broken out to the upside.  And the S&P daily chart is moving in a channel and to the upper right at about 37 degree angle.  

Whatever stocks are doing, its also worth pointing out that the 2% yield in the S&P 500 exceeds the 10-year treasury by 40 basis points.  In the end, dividends are what make stocks the place to be regardless of what the charts are doing.

Also keep in mind that the central banks can produce an almost unlimited amount of money - as long as inflation does not become a problem.  The European bankers don't seem quite as willing to create money as Bernanke and the Americans.  But when push comes to shove, they will do whatever it takes to keep the Euro, and the entire modern money economy from falling apart.  

That realization, plus a dose of potential optimism that Romney might win, are enough to keep a bid under stocks.  Have a great week.

Sunday, August 5, 2012

Meta-Trader - Forex Failure Analysis

Welcome back Meta-Traders.

Daniel  Fernandez once commented in one of his e-books that the psychology of Automated Forex Trading is one of the most difficult parts.  There's nothing difficult about making money of course, in fact what could be easier?  You just put up the robot and sit back and count the profits!

But what about when they lose money?   Its not like we arrived at these systems haphazardly.  After all, they are carefully selected from at least 10 years of back testing, with favorable risk/reward ratios, ATR based position sizing, robust coding techniques etc, etc.  And these systems were back-tested, forward tested with demo money then forward tested with real money which was earned and saved by your humble blog author.

When systems fail, the questions start to arise such as:

  • Are the systems working properly?
  • Has the underlying structure of the market changed rendering the systems no longer effective?
  • Are the forex brokers hunting my stop loss orders and since the market makers can see my stops, or put another way, is the forex market really fair?
  • Is is even possible to trade the forex markets profitably using Automated Forex trading? Sure we have 10-year back tests that are profitable, and data provide by the industry, but do we have any actual live results we can point to?
And that's when FUD (Fear, Uncertainty and Doubt) start to creep in.

Fortunately, we have plenty of data to examine the behavior of our systems.  We can compare the behavior of different instances of the same systems on different brokers.  We can also compare the behavior of systems versus their historical performance such as maximum draw down, consecutive losses and win/loss ratios.  Using those tools, let's see if we can come up with some answers to determine if we are just looking at a bad period of performance, or the entire Automated Forex Trading experiment is just low-hanging fruit for the market makers.

At the heart of my poor performance is the Atipaq USD/CHF instance which is embedded in 3 of my 4 live portfolios.  The box in the upper left shows the year-to-date performance of this instance in my Atipaq Full Portfolio account.  Atipaq USD/CHF is one of the best performing instances historically with a 16% average annual profit and a maximum drawdown of 22% on a 10-year basis.  On a year to date basis, this instance is down 17% which is not even that bad compared to its 10-year historical maximum of 22%.

To be fair, Atipaq USD/CHF had a good year in 2011, with returns of about 17% with drawdown less than 10%.  This lead the Atipaq Full Portfolio to an excellent year in 2011 and was up nearly 50% for the year.  And at one point, the portfolio was up nearly 96% from the start before it crashed and gave back all those profits and just went negative this past week when considered from the start.

Now let's try to tackle the above questions one by one:

1) Are the systems working properly?

Yes, this is clearly the case since I'm seeing consistent trading between my different instances as well as the similar systems on Asirikuy.  I'm not allowed to reveal specifics of the performance of systems on Asirikuy, but let's just say they are similar to what you see above.

2) Has the underlying structure of the market changed such rendering the systems no longer effective?

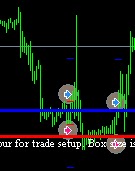
To examine this, we need to understand how Atipaq works.  Basically, it builds a box based on the range of price behavior over the Asian session, or some number of hours before the active period for the pair.  Then it basically buys or sells breakouts from the box with a TP being some multiple of the box size and the SL being the opposite side of the box.  So the real question is, how often does price movement, after breaking one side of the box, return to the opposite side of the box before hitting the TP?  It turns out the answer to this question is pretty much the win/loss ratio of the system.

The table on the left shows the win/loss ratio for Atipaq USD/CHF for the past 10 years.  Years 2002 through 2010 are based on back-testing and the figures for 2011 and 2012 are based on actual trading results.  

From the 10-year backtest, the win/loss ratio averages about 50/50, meaning it wins about as often as is loses on a historical basis.  For every dollar the system makes on winning trades, it loses about 60 cents on losing trades.  That means the system has to win only about 40% of the time to earn a profit. And we can see that for most years, the system wins  better than 40% of the time.  The only exception was 2007 where the wining % came in just under 40%

For 2012, Atipaq USD/CHF is on the losing side on nearly 7 out of 10 trades. And since the win % is clearly under 40%, the system is losing money overall.

Anyway, what this table shows is that the Win/Loss ratio for Atipaq USD/CHF is lower now, on a year to date basis, than its been any time in the past 10 years. 

3) Are the Forex Brokers hunting Stop Orders?

This one is pretty easy and is detected like this.

If the price has a single hourly candle averse move to briefly visit the price area, take out the stops then retrace back to the prior price area, the move is suspect.  Also, there would be no other trades before or after the suspect price movement for a number of bars. Unless there is a news event, there's no other explanation and its easy to see on a chart.  This particular spike may have been accompanied by a news event, since EUR/USD had a similar spike, but I can't be sure which one in retrospect.

Just how big is that hourly bar on the chart?  The range of the bar is 125 pips, versus the 14-bar ATR of the daily chart which is 140 pips.  Thus the range of that single bar represents 89% of the daily average true range of the pair!

When I started this blog post, I was suspicious that this type of price bar has caused me to lose money in GBP/USD trades lately.  Upon closer examination (using with the "browser" feature of MyFxbook), I found that I actually profited on these price spikes, once on 8/2 in GBP/USD and again on 7/27.  Also, I closed out a profitable long position in AUD/USD at the high price of that spike.

Can anything be done to put an end to stop hunting?  Well the systems can be modified to not submit stop orders and go with the broker default stop of 500 pips  The Meta-Trader systems could execute the order when the price reaches the given Stop Loss level.  This is higher risk, however since should our Meta-Trader platforms fail, we could be subject to an account-wiping adverse movement.  Also, we would still be subject to these stop-hunting price excursions since the market makers are going after much larger players then ourselves anyway.

In this end, while stop hunting is a negative for Forex as an asset class, its just as likely that we would profit from a price spike as lose money.

4) Is it even possible to trade the Forex markets on a long term basis profitably using automated systems?

In the past Daniel has pointed to data provided by the industry which indicates that Forex trading is long-term profitable by either manual or automated trading.  Its hard to trust data provided by the industry itself, and instead, I am inclined to trust data provided only by real, small investors such as myself.  I suppose the jury is still out on this question, and time will tell.

Not to be all doom and gloom, I'm having a pretty good year in equities, and Fridays +1% moving in the emerging markets ETF's EEM and EFA ended the week on a good note.

Enjoy the rest of your weekend and the coming week.

Saturday, July 28, 2012

Meta-Trader - The Big Short

Welcome back Meta-Traders.

Earlier this summer, I spent a week on a cruise ship sailing the Atlantic and had a chance to do some interesting reading. The most interesting read was The Big Short by Michael Lewis, author of the best selling Liar’s Poker. If you haven’t read Liar’s Poker, I highly recommend that book since it gives you a view inside a large bond trading house from the perspective of a college graduate going through their training program.

The Big Short tells the story of the financial crisis which came to a head in the United States in 2008 with the failure of Bear Stearns, and Lehman Brothers and the rescue of a several large financial companies in the US. The book demystifies many aspects of the crisis which continues to be poorly understood by nearly everyone and leaves us with a larger picture of dysfunction in financial markets which continues to this day.

At the heart of the crisis was a financial instrument called a Mortgage Bond was invented back in the early 1990’s by Lew Ranieri from Salomon Brothers and described in Liar’s Poker. Mortgage Backed Securities or Mortgage Bonds took a large number of individual mortgages and packaged them together into a single security which could them be sold to an institutional investor such as a pension fund or college endowment fund.

At its face, mortgage bonds were a good thing since they allowed credit to be extended to segments of the population which otherwise would not be credit worthy. Credit issuers did not have to worry so much about the credit worthiness of an individual borrower since the questionable loans could be re-packaged and sold to an investor. And since the risk of default was spread across a large number of borrowers, the risk of default was theoretically reduced. After all, while it was possible that a subset of mortgage holder would default on their mortgages, it seemed unlikely that they would default en masse. Also, since the mortgages themselves were secured by the underlying properties, each mortgage was effectively a call option on the underlying property which would pay off even if the borrower defaulted and would pay off anyway as long as property prices continued to rise.

What struck me right away was the difficulty in understanding the true characteristics of these bonds. While it was fairly straightforward to analyze the risk of a default of a single corporate or municipal issuer or even an individual mortgage holder, how could an investor possible quantify the risk of default without understanding the characteristics of each individual borrower?

It wasn’t possible of course and to make it more obscure, the bonds were given names such as NHEL 2004-1 which identified the issuer and the general time frame issuance of mortgages it contained. And each security was accompanied by mind numbing 130-page prospectus that almost nobody read except for the lawyers who drafted them. To make the risk/reward equation more palatable to investors, mortgage bonds were divided into segments or “tranches”.

Lewis describes these as a “tower” of mortgage bonds where the buyers of the lower floors were the first to take a loss and therefore were paid a higher interest rate. Buyers of the upper floors of the tower assumed less risk and were therefore paid a lower rate. Rating agencies rated each tranche of the security where the upper floors got triple-A ratings and the lower floors got lower ratings such as BBB. Institutional investors loved these securities of course since they could get an annual yield 1.5 to 2.5 percentage points above the risk free rate an still receive a triple-A rating from the rating agencies. This made the securities palatable to risk-averse investors since their charters indicated they could invest only in triple-A rated securities.

The challenge came with the lower-floors of the towers. Since these tranches were not triple A rated, they were harder to sell. Goldman Sachs found a solution for this problem by created a Collateralized Debt Obligation or CDO. These securities were simply a collection of the higher-risk and higher yielding portions of many, many mortgage bonds. Strangely, and almost magically, Goldman Sachs convinced the rating agencies to rate these CDO’s as Triple-A, thus making them palatable to risk-averse investors.

Thus was created a money machine that worked like this:

Sub-prime issuers such as the Money Store and Household Finance created and sold mortgages without regard to whether they could be repaid – and it didn’t matter since they simply originated and re-sold the mortgages and they got paid by volume

Large financials such as Goldman Sachs, Morgan Stanley, Citigroup and others purchases those bonds and re-packaged them into mortgage bonds and presented them to the rating agencies Moody’s and Standard and Poor’s.

The rating agencies analyzed and conferred AAA ratings on these securities and were paid (again by volume) by the issuer (Goldman Sachs, Morgan Stanley, Citigroup, etc).

Institutional Investors purchased the mortgage bonds and received fixed monthly payments without much regard to the risk of default – after all they were triple-A rated by Moody’s and Standard and Poor’s.

The worst of the mortgage bonds were re-packaged into CDO’s again receiving a Triple-A rating and re-sold to risk-averse investors.

Nearly everyone benefitted from the above arrangement except for the original borrowers who were saddled with mortgages which they could not possibly repay.

A disproportionate number of these mortgages took money from the poor and under- educated and fed that money to the already rich and educated.

At one point at about 2005, the demand for CDO’s became so great that there were not enough mortgage bonds to create more. As a result the big financials created the Synthetic CDO, or CDO’s created out of other CDO’s. In some bizarre arrangements, CDO #1 was created in with a part of CDO #2, a part of CDO #3 and a part of CDO #1. That’s right; there were circular or recursive arrangements of CDO’s!

A final and most confusing portion of the came in the form of the Credit Default Swap abbreviated CDS. These were essentially insurance contracts on bonds that worked as follows. The typical bond investor puts up a large amount of money (or a portion thereof) in order to receive fixed monthly payments but risks losing the entire principle amount. The purchaser of a CDS would essentially take the other side of the bet – put up a portion of the principal and pay out a fixed monthly amount in exchange for the opportunity to collect 100% (or some sub-portion) of the principle in the event of default of the issuer.

Default of the issuer was a binary event – the issuer either defaulted or they did not. In the event of a bankruptcy, assets of the issuer were liquidated and bond buyers would receive some portion of their principle back. Whatever portion they did not receive back was covered by the CDS. Purchasers of CDS could pay a small amount of the principle (between 0.15 and 2% per year) but have the chance to collect up to 100% of the principle in the event of default. Thus buyers of the CDS have a small chance to collect a very high payoff.

Some large financials – specifically AIG and their Financial Products division – sold large numbers of CDS, but were not required to reserve capital to cover potential losses. This alone was a colossal failure in regulation since AIG is an insurance company and therefore regulated by the State of New York where it is located.

A few very astute individuals realized early on that the CDO market was a disaster waiting to happen. As a result, they convinced some large financials into selling CDS or insurance on CDO’s in anticipation of collecting large payoffs when the CDO’s eventually failed. They expected to encounter a limited supply of these CDS instruments, but instead found an almost endless supply. We later found out that AIG FP was selling a large number of these CDS products and collecting huge monthly payments in exchange for insuring against losses that they could never possible cover.

The heroes of The Big Short were the few, astute individuals who foresaw the disaster and positioned themselves accordingly. Unfortunately, they never had their “champagne moment.” They ended up collecting huge sums of money, but only as a result of near collapse of the financial system. They positioned themselves for disaster in the face of huge odds and alienation of their own investors who were not patient enough to stick with the bet. They positioned themselves for a doomsday scenario, but took little joy when it arrived and instead suffered the human cost of betting against the large financials and against the capitalist system.

In the end, the Federal Reserve came to the rescue of the large financials. Citigroup, Morgan Stanley, Goldman Sachs and others received a total of 700 Billion Dollars from the TARP – Troubled Relief Asset Program. AIG Financial Products received a direct 80 Billion dollar loan from the Federal Reserve – and all of AIG FP’s products were paid in full – 100 cents on the dollar by money created out of nowhere by the Federal Reserve. Most of this money went into the hands of those who took the other side of the bet – about 14 Billion went to Goldman Sachs. The Fed’s justification was that they had to make whole on those commitments to avoid a cascade of defaults – so called systemic risk.

What about the management and employees of AIG and all the millions of money they collected selling insurance that they could not cover? Did they have to give back all those millions? The answer is no since they did not break any laws.

So what can we take away from all of this?

1) Understand the risks you are taking with your investments. Traders of these products did not understand the risks, nor did their own management much less their boards of directors and shareholders. Those who truly understood the risks made big money but paid a cost in human terms.

2) Don’t borrow money you can’t afford to repay. If someone is stuffing money into your pockets, understand where that money is coming from and what it is going to cost you down the line.

3) Be careful with doomsday scenarios whether it is in Europe or the United States. The world’s governments and central banks have an almost unlimited ability to create money out of nowhere to continue the status quo in the financial system.

In essence this last item means do not be afraid of doomsday scenarios. There are plenty of reasons to fear financial contagion in Europe and the United States. The investors who ultimately profit are the one who realize that the world’s central banks will do almost anything required to prevent collapse of the global financial system.

That’s enough for now, go forth, prosper and don’t fear the reaper.

Saturday, July 21, 2012

Meta-Trader - Meet Oliver Velez

Welcome back Meta-Traders.

In this post, we meet Oliver Velez, the founder of http://www.ifundtraders.com/.   I have seen presentations by Mr Velez on several occasions at the Traders Expo in New York City.   He is a very powerful personality and very persuasive.  And his product is somewhat unique in the world of trading in that he offers you a path to enter the world of professional trading.

Nearly everyone who trades for a living has to learn from someone. Ideally, that person is sitting next to you on a trading desk.  You show up every day and learn the setups the twists and turns, the big events and basically learn by observation and by doing.

Another personality I profiled on this blog named Hubert Senters met his mentor somewhat by accident when he visited the farm as part of his training to be a veterinarian.  Once he saw the flashing numbers and tens of thousands of dollars being made and lost, he was instantly hooked.  And thus began his education as a trader.

There is another and more traditional path to the trading desk that goes like this.  Get accepted to and graduate from a top Ivy League University (Harvard, Princeton, Yale, etc).  Graduate with top honors then apply to and get accepted as a new hire to a top trading firm such as Goldman Sachs.  Once you pass all those hurdles, you earn a seat on the trading desk at Goldman Sachs.  Jim Cramer tells a very funny story that after graduating from Harvard Law,  he was hired by Goldman Sachs.  And after all that training and education, there we was on the trading desk and his first official duty was ... take orders and go out and bring in pizza for the trading desk!

So what options are available to the rest of us who have zero chance of every making it through the front doors at Goldman?  Oliver Velez provides such a path and it works like this:

  • Pay iFundTraders a starting fee of approximately $7500 and go through his training program.  
  • Next, you are paired with another trader who becomes your mentor with whom you trade in demo mode for some period of time.
  • Once you graduate from demo mode, you are funded with a real money account of approximately $10,000.
  • Once you pass a certain performance goal, you are funded with a larger amount of money. 
  • After that, you climb a performance ladder where, if you are successful, you are funded with ever larger amounts of Oliver's money, and Oliver takes a cut of your profits after you earn your original $7500 back.

Following such a structure, Velez has a created a firm iFundTraders LLC where he has a network of traders around the globe that trade the firms money.  The best traders rise to the top and trade ever larger amounts of money up to some maximum of the firms 11 million in capital.  Those who don't rise to the top - which I assume are the vast majority - keep trying and keep showing up for each days trading.  He claims you will never be kicked out of the program and you get infinite retakes of his educational programs until you become successful.

To be clear, Velez is not a trader himself, he is a salesman.  And I have never met a more persuasive salesman.  He is also an excellent educator and if you have never heard him speak, head over to http://iFundTraders.com or http//www.moneyshow.com and listen to one of his presentations.  In one recent presentation, he talks about how his traders key off the first 5-minute bar of the day, and he indicates that 82% of the time, the market trends in the direction of the first 5-minute bar.   He also uses 8 period, 20 period and 200 period moving averages across several time frames.  There is a wealth of information available basically for free in nearly any of his 1-hour presentations.  If you haven't heard him speak, I highly recommend you check it out, its well worth an hour of your time.

But should you give any of your money to Oliver Velez?   I haven't done so and here's where you need to be careful.  I went to Google and searched for Oliver Velez and due to Google's wonderful auto-fill in feature, I found the 3rd and 4th most popular search terms were "Oliver Velez Refund" and "Oliver Velez Criminal".  Following the 3rd one, I came across http://olivervelezrefund.com/ which claims that Velez has been involved in at least one scam where his trading firm (and customer funds) essentially disappeared with no chance of refund.   Also following a link on the site, I found a place where you can download the PDFs behind Oliver's 2-day Equity Trading seminar that he charges $3495 to attend in person.  If nothing else, download and checkout the PDF's, there's a lot of good educational material in there.

Velez also does Forex Trading and has a program for Forex Traders.  He even has his own version of the Meta-Trader platform along with some automated alerting and stop calculations for which he charged $65 per month.  Perhaps I'll get to that in a future post.

Automated Forex Trading was mixed this week with some up and some down.  There's not much to say about it and I'll let the numbers speak for themselves.

That's all for now, enjoy your weekend.

Sunday, July 15, 2012

Meta-Trader - A kick to the gut

Welcome back, Meta-Traders.

It has often been said that nothing new ever happens in the world of trading and investing. And while that may be the case, nature sometimes has a way of whacking you in the head, from an unexpected direction and at an unexpected time.

Thus was the case this past week with the announcement of the attempted suicide of PFG Best founder and Futures industry icon Russ Wassendorf. And that news was accompanied by a raft of other disturbing developments:
  • Wassendorf attempted to commit suicide, unsuccessfully, and instead ended up in the hospital in critical condition. He has since recovered and is now in police custody.
  • Wassendorf left a note in the car that stating: "I have committed fraud ..I feel constant and intense guilt.”
  • Allegations indicate that the fraud as continued for decades and involved using customer funds and fraudulent bank statements to deceived customers, regulators, employees and the very community where Wassendorf did business.
  • Apparently, USD $200 million of customer funds are missing and PFG is now the target of investigations by the NFA, FBI and the US Justice Department.
What makes this case so disturbing is that Wassendorf was an industry icon. For over 10 years, I have been reading and benefiting from free trader education from Stock Futures and Options Magazine which continued in glossy print for many years and went all-electronic in the past year or so. I regularly commented on recent Facebook posts from Phil Flynn, Debbie Carlson and other industry figures.

Also, Wassendorf built an 18-million company headquarters in Cedar Falls, Iowa (shown above) which included day-care, a 4-star cafeteria and state of the art geothermal climate-control technology. He employed industry heavyweights and published their analysis and trading techniques in a separate publishing arm in support of the brokerage. He was a pillar of the community, trader, activist, business owner and employer.

But in the end, it was all a lie. The suicide notes says: "I was forced into a difficult decision: Should I go out of business or cheat?" he wrote. "I guess my ego was too big to admit failure. So I cheated." And he cheated by violating the most fundamental rules of the brokerage industry, by using customer funds to keep afloat a failing business.

Even more disturbing was how he deceived the regulators. PFG Best was regulated by National Futures Association or NFA. This is the same organization that regulates Future and Forex Brokers in the US. Apparently, when NFA required proof of bank deposits, Wassendorf redirected the request for bank confirmation to a destination at a post office box, and simply crafted fake bank statements using a combination of photoshop, excel spreadsheets and laser and ink-jet technology. Apparently, no-one else was complicit in the fraud including his son, Russ Wassendorf Jr who was also a victim of the fraud and has been cooperating with the authorities in the investigation.

As if all this wasn’t enough, we have a recent history of spectacular industry and regulatory failures from MF Global, Refco and the biggest fraud of all from Ponzi schemer Bernard Madoff. Each case was large, spectacular and utterly undetected by the regulators whose very job it is to keep the customer’s money safe! I believe most of the missing funds were recovered in the case of MF Global.

A recent news story from Forbes.com indicates that an independent web site http://www.confirmation.com – which provides a simple 3rd party confirmation of bank deposits independent of both the regulator and the company – brought down the fraud at PFG Best. For many weeks and months Wassendorf has resisted use of confirmation.com to validate his bank deposits. And the very prodding of this organization brought the fraud to light before it got larger and took down more victims.

Fortunately for me, I did not lose any money in this fraud. But it seriously undermines my confidence in the money and regulatory establishments in nearly every respect. Clearly, the single-person nature of the fraud does not extend to every public company and regulatory institution. But it does call into question the financial security of the companies I routinely do business with.

Along those lines, I took a look at the Web site for E*Trade Securities, the brokerage which holds the majority of my financial assets. All the way at the bottom of the Web site is a link to an item called “Statement of Financial Condition”. The most recent statement is preceded by a letter by auditor Deloitte and Touche with the following text:

“We conducted our Audit in accordance with auditing standards generally accepted in the United States of America. Those standards require that we plan and perform the audit to obtain reasonable assurance about whether the financial statement is free of material misstatement. An Audit also includes consideration of internal controls over financial reporting as a basis of designing audit procedures that are appropriate in the circumstances, but not for the purpose of expressing an opinion on the effectiveness of the Company's internal control over financial reporting. Accordingly, we express no such opinion..."

I take this statement to mean the auditors can be fooled by simply presenting them with fraudulent or incorrect data. So what is an investor to do, can any brokerage be trusted to keep your money safe?
Customers of banks in the United States are protected by failure of the bank by the Federal Depositors Insurance Company or FDIC. Customers of securities companies are protected by the Securities Investors Protection Corporation or SIPC. I checked the SIPC Web Site at http://www.sipc.org and found that my brokerage E*Trade Clearing LLC is indeed a member of SIPC. I also found that the clearing firm for PFG Best “BEST DIRECT SECURITIES LLC” is also listed as a member of SIPC on the SPIC web site. That means that PFG Best customers should get their money back although the SIPC Web Site indicates it can sometimes take many months for customer to get their money back if financial fraud was involved in the claim.

Clearly as a brokerage customer, there are more ways to lose money that just making bad investment choices or having the markets move against you. So what are the key takeaways here?
  • Examine the statement of financial condition of the broker that holds your funds.
  • Examine the Annual Report of the Brokerage Company or LLC and try to determine if the brokerage actually generates enough in commissions to meet their operating costs.
  • Understand what are the entities that protect your funds (FDIC, SIPC) and verify that your brokerage is actually a member of that site from the SIPC or other Web Site
  • Understand the limits of the protection provided by that entity and be prepared to lose anything above those limits unless they are covered by another insurer.
The world is a risky place, and financial fraud is one more way to lose your hard-earned money.

Do some diligence on the firms you work with to protect yourself from financial fraud.

Be careful out there and have a great week.

Sunday, July 8, 2012

Meta-Trader - Automated Forex Trading - 2012 Halftime Report

Welcome Back Meta-Traders.

Since 2012 is now half in the books, its a good time to do an assessment of where we are with Forex trading.  This past week is a good place to start, since it was a very active week as Automated Forex Trading goes.  And this past week's action reflects some larger themes that we seen so far in 2012.

The first account up is Atinalla #1. This account had a good week and is now down -3.91% for the year and is up 25.26% since starting it back in November of 2010.  The system had some good results this week taking gains from all 3 embedded systems most notable of which is Teyacanani which is still short EUR/USD of this writing.

Next up is Atipaq Full Portfolio which lost about 5% for the week and is now down a stunning 31.93% for the year, but still up slightly since starting.   The week started out good with gains in GBP/USD and USD/CHF, but ended the week with a sequence of losing trades including 3 consecutive losers on USD/JPY, followed by a loss in USD/CHF then a large loss in AUD/USD.   This account has been a roller-coaster ride being up as much as almost 96% earlier this year and has given it all back and is now up just slightly because I added some funds to it earlier this year.

The first question I ask myself is - are the systems in Atipaq Full Portfolio trading properly?  To find out, I ran a back-test for 2012 to date and got the results shown in the above graphic.  The red line indicates the overall portfolio performance which bears a striking resemblance to my actual portfolio performance.  Plus the fact that I see a similar performance over on the Asirikuy site.  So the short answer is Yes - the systems are trading properly.

Looking at the chart on the left, it seems obvious in retrospect that I could have bought and sold  trendline breaks.  This is a pretty common tactic in equity trading.  Based on a quick visual analysis, I could have been up about 125% - and instead have held onto the gains!   Note that the system is not foolproof of course since I would have bought into the recent uptrend onto to see the system go to a new equity low.

Thinking deeply about Atipaq and its performance, it struck me that its performance could be improved by switching back and forth between buying breakouts (its normal mode of operation) to selling or fading breakouts.

So I flipped the logic to sell breakouts instead of buying breakouts and ran a back test for 2012 to date. I expected to see the mirror image of the systems equity graph, showing about a 30% gain for the year.  Instead, I got the graph shown on the left, where all of the systems trading in reverse mode were unprofitable except for USD/CHF which showed a small profit.   I believe the reason for this is that the system takes larger losses than gains in when running in reverse mode - exactly the opposite of normal Atipaq behavior. Perhaps there are a different set of parameters which takes equal size profits and losses and still comes out ahead to to more breakouts failing (returning to the opposite side of the breakout box) than reaching the pre-defined multiple of the box size to take a profit.

Next up is COATL H1 which has been inactive since earlier this year due to problems with the system.  I'm still looking for a set of systems for which to deploy these funds.  Given the overall record here, I think cash is the safest place for these funds now!

Next up is Atinalla No 3 which suffered from the same losses in USD/CHF and USD/JPY as did Atipaq full portfolio.  Atinalla No 3 is now down about 16% since startup back in January 2011.

Next up is Atinalla Custom which runs Teyacanani, another system from Atinalla No 1 and one system from Atipaq  Full Portfolio.   It had a decent week picking up about 6% but is still down a bruising 32.7% since startup back in November of 2010.  This test is not quite so pure since I have run a combination of systems over time, but it has been stable for the past year or so.

Last up is Sunqu which has been inactive due to a DLL problem.  This is unfortunate since the system had a large spike of profitability on based on other systems on Asirkuy that I missed out on.

So what has been gained and what has been lost so far in my Automated Forex experiment?

What has been gained?

  • I am trading transparent systems which I fully understand and are back-test and live test consistent
  • I am trading automated systems which can be compared against other systems on Asirikuy on a trade-by-trade basis to get an understanding of whether the systems are trading properly

What has been lost?
  • Money - I added it all up, and I am down -$1893 or about -9.2% of the 20,000 I have invested in Automated Trading.  Its interesting to note, however, that I was up as recently as March of 2012 and went into drawdown based on losses in Atipaq full portfolio.>
  • This doesn't include the funds I pay to belong to Asirkuy and the electricity required to power my computer which runs the systems. These are small costs of course in the large scheme of things. Also, I never paid any money to run a VPS system, so there was some cost save there.

Despite the loss of funds, Automated Trading has been a good experience and I have gained understanding in the process which is the true goal of Asirikuy. And since I believe fundamentally in the systems I'm going to stick with them until they recover or go bust and the odds of either outcome look equally likely at this point.

That's all for now, enjoy the rest of your weekend and the coming week.

Sunday, June 24, 2012

Meta-Trader - TC2000 meets the iPad


Welcome back Meta-Traders.

The brothers Worden have done it again and this past week released their flagship TC2000 charting product for the iPad.  It was previously available for iPod touch - as well as the the native PC and Macintosh platforms.  The PC and Mac versions make use of Microsoft Silverlight technology which delivers PC type application performance - but for Web-based applications.  There's no Silverlight for the iPad, so this is a native iPad app.

On first appearance, the product has all the familiar features, charts on the right, columns and watch lists on the left.  Zoom in and out works as expected where you pinch to zoom and in and out, and the chart re-renders within the available space.  To change time frames, use the pull down at the top of the screen.  To change the size of the columns area, or make charts bigger or smaller, just drag the border between the columns and charts with your finger.

The cool thing about this version, and the iPad version is that there's no extra charge.  Just login with your existing TC2000 account and off you go.  It shows you that Worden's first objective is to deliver amazing products and let the financials work out themselves.  Great job Worden brothers and keep it up.  I have been using Worden brothers products since the 1980's and I consider it my primary research tool.   Where else can you take the entire stock market, cut it down to stocks making all time highs today, then rip through each one of the individual charts in just a matter of minutes?

More importantly, the product takes the monstrous amount of data that is the US stock market and allows you to chop, slice and dice it and visualize it nearly any way you like.  Plus throw in real-time streaming intraday charting for about $300 a year - you can't beat it.

World markets breathed a sign of relief past week when people of Greece voted in the moderate party who was in favor of staying in the Euro zone.  But that result was largely factored in from the prior weeks rally and stocks had little left to celebrate.  The above chart of EFA - the iShares MCSI Markets index tells the story.  We had about a 10% rally off the lows set back in early July. Thursday's sell-off took back have of that move (that took 13 days to play out) in a single huge bear elephant candle.  In Fridays action, we gapped up slightly then settled well within the range of Thursday's candle.

As for now, there seems to be a stand off between risk off and risk on.  I am abut 45% in cash, but still well ahead of the S&P 500 for the year.

Forex continued its recently lackluster performance with 2-3% losses in all accounts except for Atipaq Full Portfolio which gained about 2% for the week.

That's all for now, keep your powder dry and have a great week.